Jan 2, 2019
Comments
We need to talk about calories! Not the calories from your Christmas cookies -- those don’t count. But, calories in your Qt application. We’re going to take a look at a technique that is easy to enable and helps you save precious bytes around your application’s waistline.
The Old vs The New
Traditionally, you would build your application by letting the compiler translate your .cpp source files to machine code. The result is stored in .o object files, which we then pass over to the linker, to resolve references between the files. At this point, the linker does not change the machine code that was generated. This division of work between the compiler and the linker allows for quick development cycles. If you modify one source file, only that file gets recompiled and then the linker quickly re-assembles the application’s binary. Unfortunately, this also means that we are missing out on an opportunity to optimize.
Imagine that your application has two functions: main() in main.cpp and render() in graphics.cpp. As an experienced developer, you keep all your graphics code encapsulated in the render() function -- anyone can call it from anywhere! In reality, it is only the application’s main() that calls render(). Theoretically, we could just copy and paste the code in render() into main() -- inlining it. This would save the machine code instructions in main() to call render(). Once that’s done, we may even see opportunities to reuse some variables and save even more space and code. Now, if we tried to do this by hand, it would quickly escalate into Spaghetti code with lots of sauce.
Luckily, most compilers these days offer a technique that allows you apply such optimizations (and deal with the spaghetti mess) while retaining the modularity and cleanliness of your code. This is commonly called “Link Time Optimizations” or “Link Time Code Generation”. The latter describes best what really happens: Instead of compiling each source file to machine code one-by-one, we delay the code generation step until the very end -- linking time. Code generation at linking time not only enables smart inlining of code, but it also allows for optimizations such as de-virtualizing methods and improved elimination of unused code.
Link Time Optimization in Qt
To enable this technique in Qt, you have to build from source. At the configure step, add -ltcg to the command line options. We thought hard, and this is the most cryptic and vowel-free name we could come up with ;-)
To demonstrate the effectiveness of Link Time Code Generation, let’s look at a fresh build of the Qt 5.12 branch, compiled with GCC 7.3.0 for ARMv7 against an imx6 Boot2Qt sysroot. For analysis, we’re going to use Bloaty McBloatface (https://github.com/google/bloaty), which is a lovely size profiler for binaries. The Qt Quick Controls 2 Gallery, statically linked, serves as a sample executable. When running bloaty on it, with a regular Qt build, you’ll see output like this:
    VM SIZE                      FILE SIZE

 --------------                --------------

   0.0%       0 .debug_info      529Mi  83.2%

   0.0%       0 .debug_loc      30.4Mi   4.8%

   0.0%       0 .debug_str      18.6Mi   2.9%

   0.0%       0 .debug_line     14.2Mi   2.2%

  68.1%  13.9Mi .text           13.9Mi   2.2%

   0.0%       0 .debug_ranges   9.60Mi   1.5%

   0.0%       0 .debug_abbrev   6.29Mi   1.0%

  29.5%  6.01Mi .rodata         6.01Mi   0.9%

   0.0%       0 .strtab         3.17Mi   0.5%

   0.0%       0 .symtab         2.35Mi   0.4%

   0.0%       0 .debug_frame    1.80Mi   0.3%

   0.0%       0 .debug_aranges   485Ki   0.1%

   1.2%   249Ki .data.rel.ro     249Ki   0.0%

   0.3%  68.2Ki .ARM.extab      68.2Ki   0.0%

   0.2%  38.2Ki .bss                 0   0.0%

   0.1%  30.3Ki [25 Others]     35.4Ki   0.0%

   0.1%  30.3Ki .got            30.3Ki   0.0%

   0.1%  24.1Ki .ARM.exidx      24.1Ki   0.0%

   0.1%  15.1Ki .dynstr         15.1Ki   0.0%

   0.1%  13.6Ki .data           13.6Ki   0.0%

   0.1%  13.2Ki .dynsym         13.2Ki   0.0%

 100.0%  20.4Mi TOTAL            637Mi 100.0%
The “VM SIZE” column is what’s particularly interesting to us -- it tells us how much space the different sections of the program consume when loaded into memory. Here, we see that the total cost will be ~20 MB.
Now, let’s compare that to a build with -ltcg enabled.
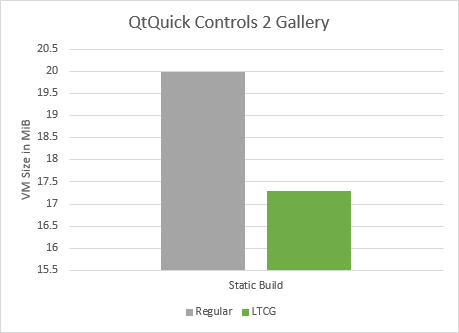 The new VM size is at 17.3 MiB -- that’s nearly a 15% reduction in cost, just by passing a parameter to configure.
This drastic gain here is because we chose a static build. However, even when you use a dynamic build, this optimization is worth it. In this case, LTCG is applied at the boundary of shared libraries.
Bloaty can show this by comparing a regular build against an LTCG-enabled build of libQt5Core.so.5.12.0:
    VM SIZE                      FILE SIZE

 --------------                --------------

...

 -53.8%     -28 [LOAD [RW]]          0  [ = ]

...

 -11.9% -1.78Ki .got           -1.78Ki -11.9%

  -0.2% -3.05Ki .rodata        -3.05Ki  -0.2%

 -10.0% -3.54Ki .rel.dyn       -3.54Ki -10.0%

 -17.2% -7.52Ki .ARM.exidx     -7.52Ki -17.2%

 -16.9% -18.4Ki .ARM.extab     -18.4Ki -16.9%

...

 -21.2%  -691Ki .text           -691Ki -21.2%

 -13.9%  -727Ki TOTAL           -838Ki -13.8%
The linker produced a smaller library with less code, less relocations, and a smaller read/write data section.
Conclusion
At this point, this seems like a win-win situation, and you may wonder: Why isn’t this enabled by default? No, it’s not because we’re stingy ;-)
One issue is that in the Qt build system, currently, this is a global option. So if we were to enable this with the Qt binaries, everyone using them will be slowed down and it requires them to opt-out explicitly, in the build system. We’re working on fixing that, so that eventually, we can ship Qt with LTCG enabled, and then you can enable this at application level.
Another issue is that by delaying the code generation to link time, we are increasing the time it takes from modifying a single source file to creating a new program or library. It’s almost as if you touch every single source file every time, making it less practical for day-to-day use. But, this optimization is definitely something that fits well into the release process, when creating your final build. So, your Release Manager can use it.
Blog Topics
Related Articles

Qt Creator 20.0.1 released
We are happy to announce the release of Qt Creator 20.0.1! The release..
Read Article
Qt for MCUs 2.12.2 LTS Released
Qt for MCUs 2.12.2 LTS has been released and is available for download...
Read Article
A Cross-Platform Rust UI Framework via Qt’s Bridging Technology
Rust has achieved something extraordinary: it genuinely excites people to..
Read Article