

.png)

Qt Framework
Build Better Software Faster
A comprehensive set of programming libraries and APIs for building complete cross-platform products with native performance.
Qt Framework gives the flexibility to combine a wealth of components:
USER INTERFACES | 3D & 2D GRAPHICS | GRAPHS | NETWORKING & CONNECTIVITY | DATA HANDLING | ACCESSIBILITY | CYBERSECURITY | FUNCTIONAL SAFETY
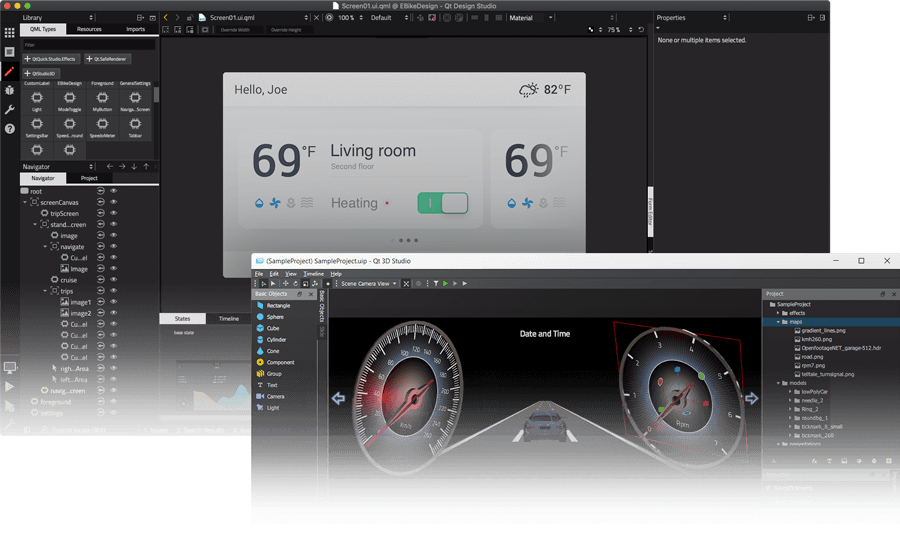
Development Tools
Developing with Qt Framework is possible using various Integrated Development Environments (IDEs) and a wide range of development tooling from coding, building, compiling, unit testing, localization, and more.
Explore Development Tools for Qt


Cross-Platform Agentic Development
The shift is already happening.
Become the director of agentic workflows with Qt - today, not tomorrow.
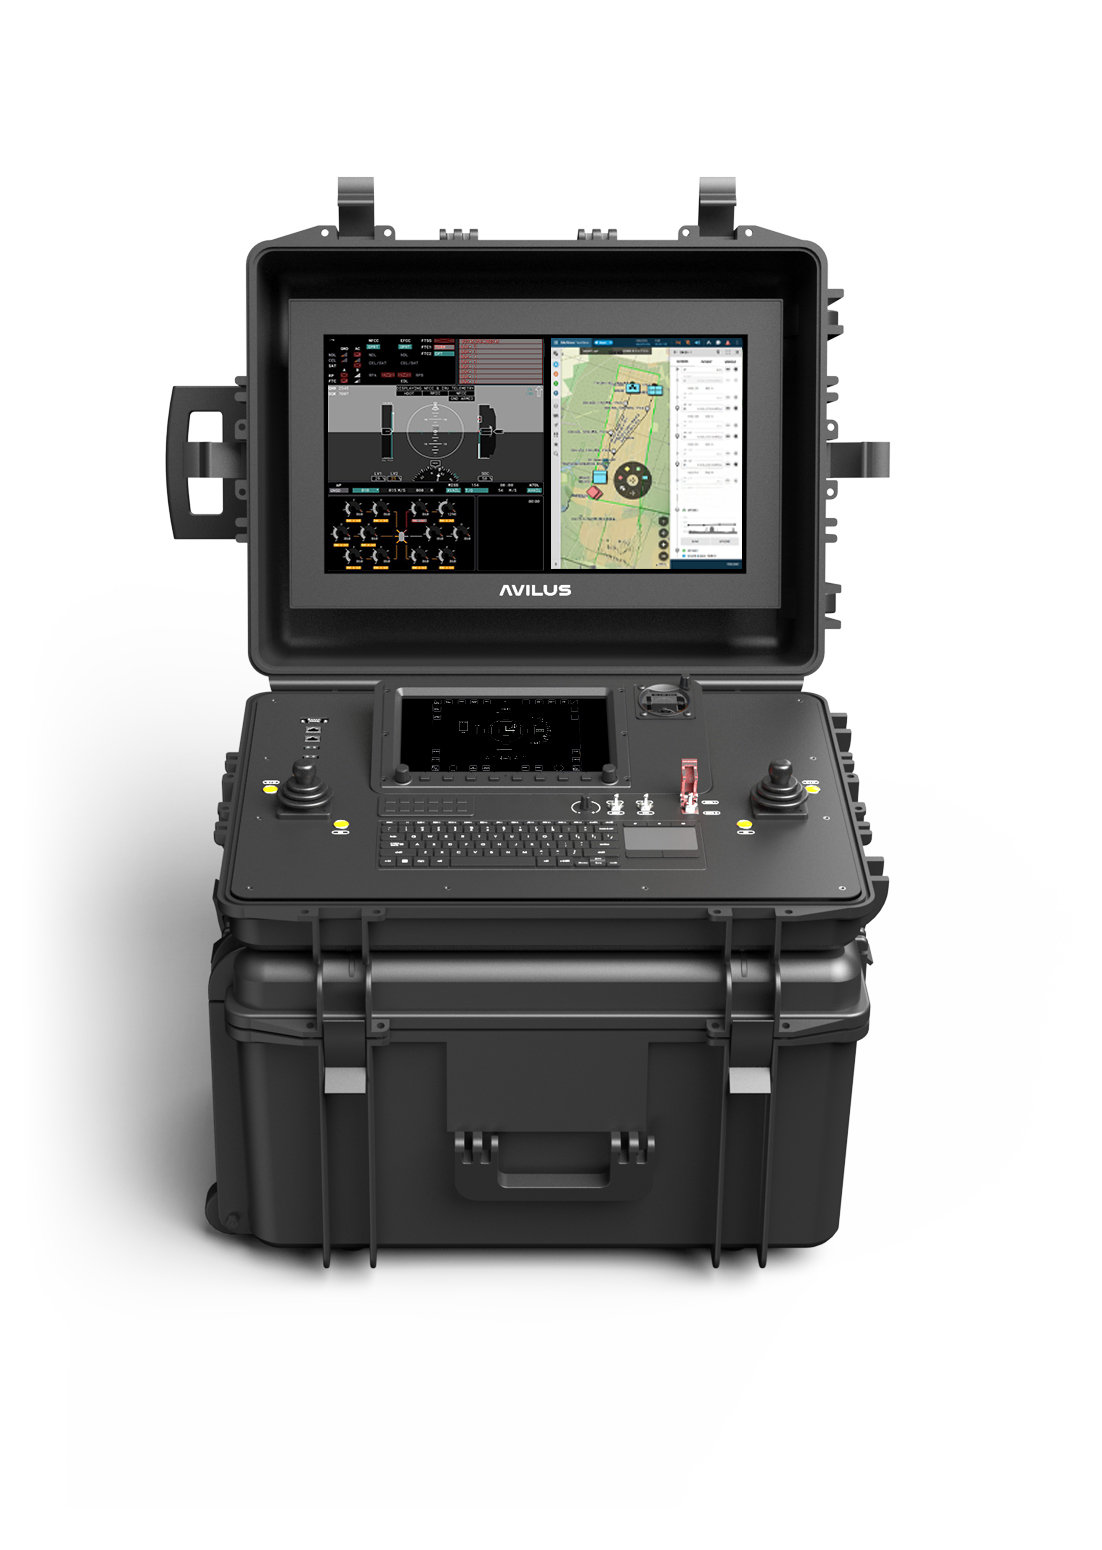
Avilus | Built with Qt
Avilus uses Qt to build high-performance, certifiable operator interfaces for a new class of dual-use drones.
Read More
Agile Robots | Built with Qt
Agile Robots uses Qt for the creation of high-performance teach pendants for its cross-platform capabilities, C++ integration, and CRA compliance.
Read More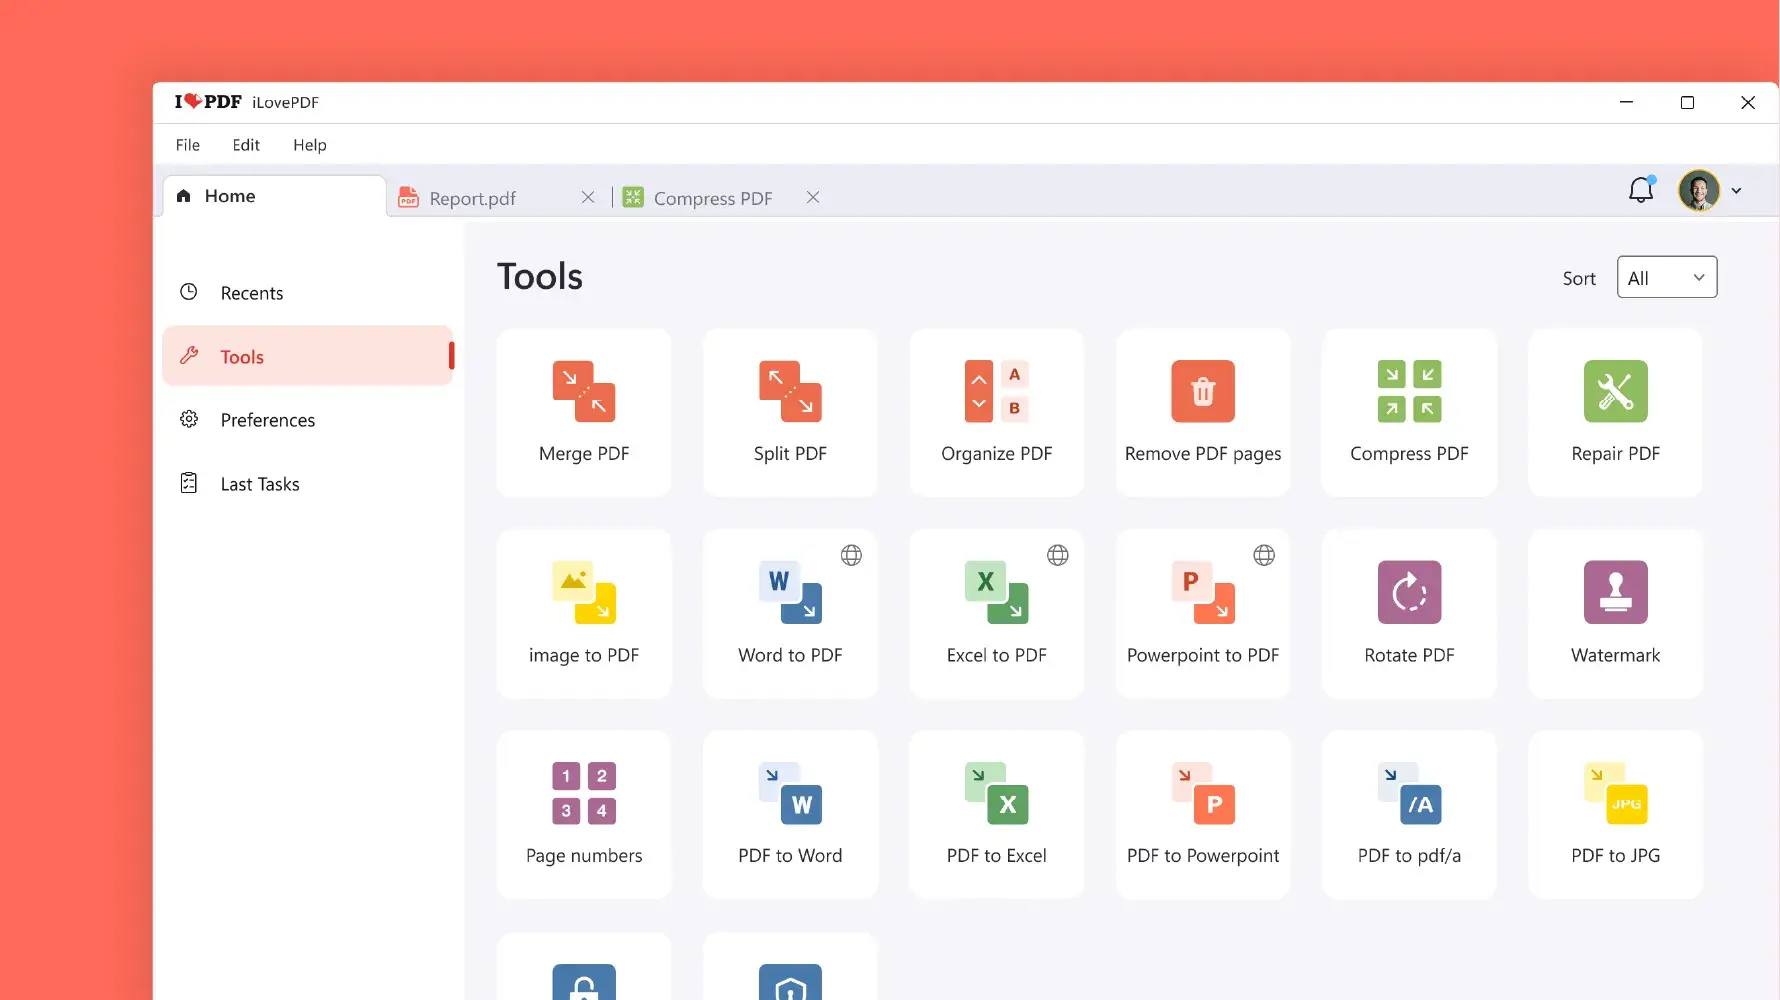
iLovePDF | Built with Qt
Learn how iLovePDF gained a modern UI and significantly improved performance by switching to Qt 6 and the declarative QML language.
Read More
Foilone | Built with Qt
Learn how Qt Professional Services helps the Marine Industry fast-track HMI development with out-of-the-box solutions that are deployed in a week whil...
Read More