Apr 8, 2022
Comments
In Qt 6.3 we have added QML Profiler events in QtQuick3D. Starting with Qt Creator 7.0 you can see the events in QML Profiler timeline.
Example: Outrun - automotive demo
Trying to find out what is wrong without profiling tools takes a lot of unnecessary guessing and sprinkling of debug prints. QML profiler can easily show where the time goes.
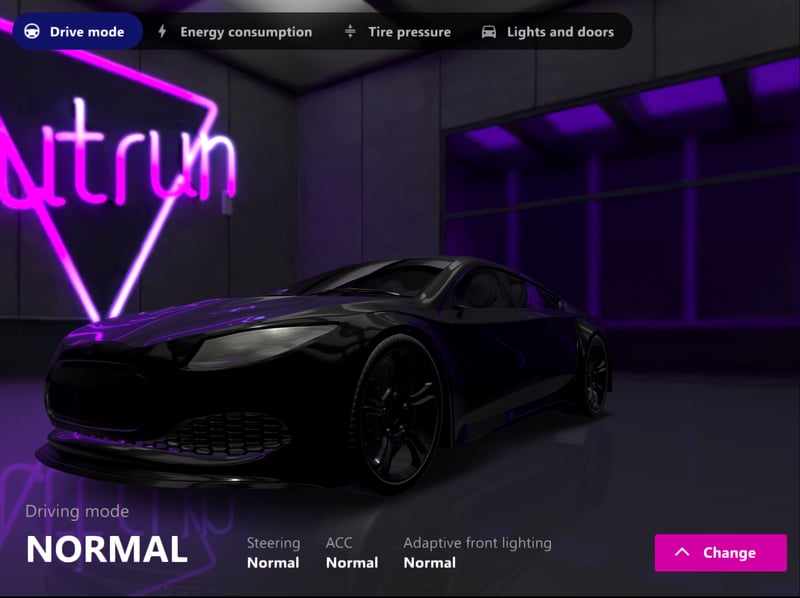
A 3D scene implemented with QtQuick3D running on Google Pixel C Android tablet.
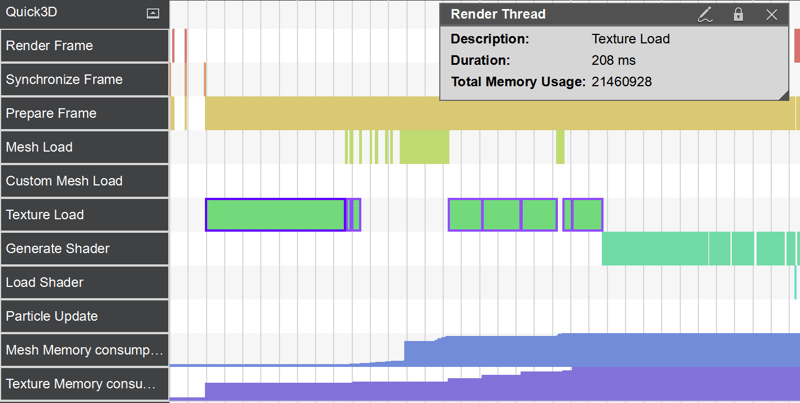
With the new QtQuick3D Profiler events we can see a suspiciously long texture load taking up 208ms, a 1/4 of the loading of the scene. In total all texture loading takes almost 1/2 of the scene time, 1/3 goes to shader generation and 1/4 to mesh loading.
Sorting the project files in size order we find long texture load to be the background cube map texture weighing 78MB. Additionally, all textures are in PNG format instead of compressed texture format such as ASTC.
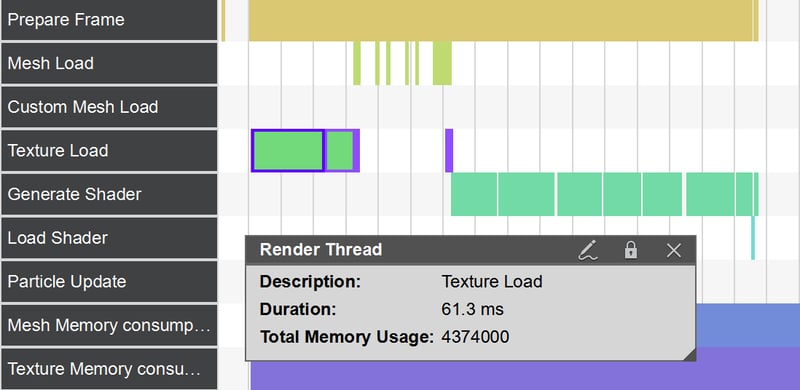
Reducing the resolution of the cube map from 4k to 1080p reduces the file size to 18MB and load time to 61ms. With the smaller resolution cube map and changing the PNG images to high quality ASTC compressed textures nearly halves the frame preparation time. The next step is to find the right balance in fidelity and usability.
For all the events added look at the documentation https://doc.qt.io/qtcreator/creator-qml-performance-monitor.html#analyzing-qt-quick-3d-events .
Blog Topics
Related Articles

Qt Creator 20.0.1 released
We are happy to announce the release of Qt Creator 20.0.1! The release..
Read Article
Qt for MCUs 2.12.2 LTS Released
Qt for MCUs 2.12.2 LTS has been released and is available for download...
Read Article
A Cross-Platform Rust UI Framework via Qt’s Bridging Technology
Rust has achieved something extraordinary: it genuinely excites people to..
Read Article