Version 5 of Coco supports the performance measurement of an application with its new, built-in Function Profiler. Like any profiling tool, this consists of providing information on the time consumed by a procedure.
Here, we present how to work with Coco's profiler using an expression parser example. This article covers compiling the application, narrowing down the performance issues, identifying problematic functions, rewriting the source code and comparing the refactored code's performance to the original version. Let's get started.
Application Building
From the code generation, enabling the profiler requires only that you compile with an additional flag to the coverage flags: --cs-function-profiler.
Two options are available:
--cs-function-profiler=all: profile all functions;--cs-function-profiler=skip-trivial: skip single statement functions (often getter or setter functions.)
After building, collecting the profiling data is the same as collecting the coverage data. No additional work is necessary to analyze the results using the CoverageBrowser.
For our parser sample, in the instrumentation script, we simply add the switch --cs-function-profiler=all to the COVERAGESCANNER_ARGS flag, and rebuild and execute the tests using:
$ make -f gmake.mak clean parser tests
Analyzing the Performance Issues
Identifying the Test Cases
Using the Executions window of the CoverageBrowser, we see that some tests result in high execution times:
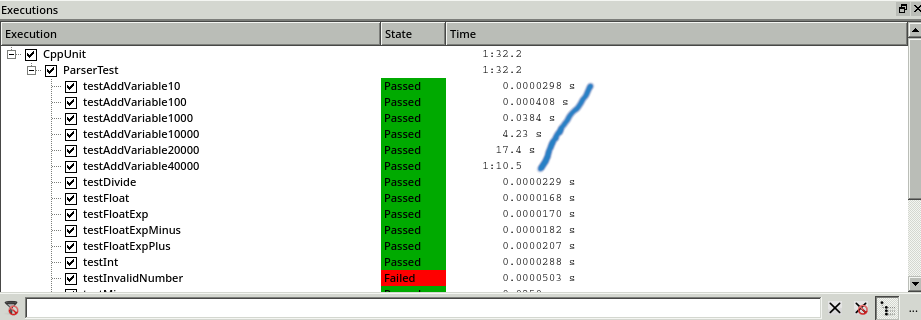
The tests consist of adding new variables. We can see that the time spent in this functionality is increasing exponentially with the number of insertions.
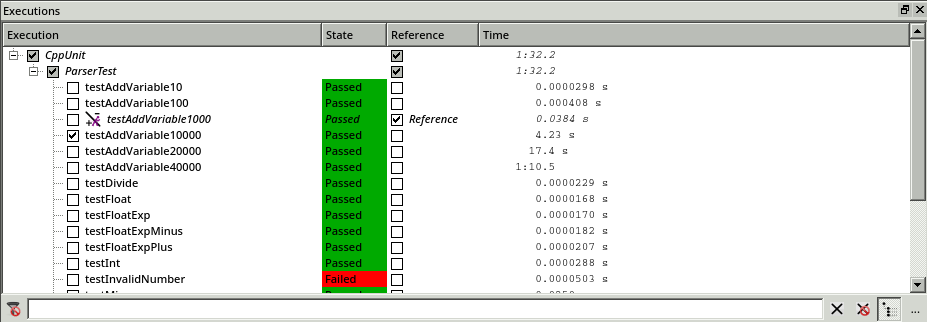
To analyze the situation, we use the execution comparison mode in the CoverageBrowser (File --> Execution Comparison Analysis.) We select the test with 1 000 variable insertions as a reference test, and we compare it to the test with 10 000 insertions.
Identifying the Problematic Functions
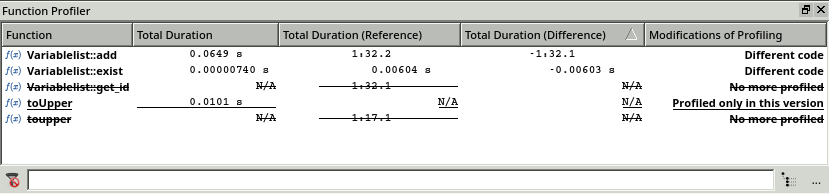
Moving to the Function Profiler window permits a more detailed analysis:
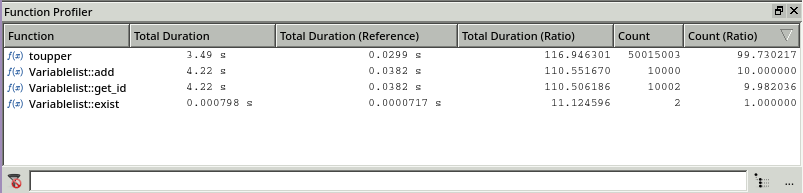
This window displays the execution time and call count for the current test with 10 000 insertions and the reference test with 1 000 insertions (columns with the keyword (Reference) in the header.)
Additionally, two additional columns are listed for computing the ratio of the current test to the reference, given by:
ratio = duration of test_current / duration of test_reference
Using this information, it is easy to see that for a test set which is growing by a factor of 10, the execution time of toupper(), Variablelist::add() and Variablelist::get_id are increasing by a factor of over 100. Further, reducing the call to toupper() seems to be necessary because the number of executions is increased by a factor of 99 whereas the others are less than 10.
Now, if we look at the code behind these functions, we see a classic source code example originally written in C: usage of char* and manual handling a list of elements into a table. STL containers are used but just to replace the classic C arrays. get_id() is a function which finds the position of the variable in the table by iterating over the complete table. So, with a complexity linear to the number of allocated items, it could be logarithmic in the case of a binary search. Also there is a call to toupper() after each iteration, which further slows down the algorithm.
/*

 * Add a name and value to the variable list

 */

bool Variablelist::add(const char* name, double value)

{

    VAR new_var;

    strncpy(new_var.name, name, 30);

    new_var.value = value;
int id = get_id(name);
if (id == -1)
{
// variable does not yet exist
var.push_back(new_var);
}
else
{
// variable already exists. overwrite it
var[id] = new_var;
}
return true;
}
/*
* Returns the id of the given name in the variable list. Returns -1 if name
* is not present in the list. Name is case insensitive
*/
int Variablelist::get_id(const char* name)
{
// first make the name uppercase
char nameU[NAME_LEN_MAX+1];
char varU[NAME_LEN_MAX+1];
toupper(nameU, name);
for (unsigned int i = 0; i < var.size(); i++)
{
toupper(varU, var[i].name);
if (strcmp(nameU, varU) == 0)
{
return i;
}
}
return -1;
}
/*
* str is copied to upper and made uppercase
* upper is the returned string
* str should be null-terminated
*/
void toupper(char upper[], const char str[])
{
int i = -1;
do
{
i++;
upper[i] = std::toupper(str[i]);
}
while (str[i] != '\0');
}
Rewriting the Source Code
The solution here is simple: replace this array through a simple std::map. Here is the updated code:
std::map<std::string, double> var;
bool Variablelist::add(const char* name, double value)
{
var[ toUpper( name ) ] = value ;
return true;
}
bool Variablelist::set_value(const char* name, const double value)
{
return add(name, value);
}
std::string toUpper(const char str[])
{
std::string upper;
upper.reserve(NAME_LEN_MAX);
int i = -1;
do
{
i++;
upper += std::toupper(str[i]);
}
while (str[i] != '\0');
return upper;
}
Here toupper() is rewritten for std::string and the function add() is only a simple affectation of std::map, which has a logarithmic complexity.
Comparing Results
We can re-execute the tests with the newest version and compare the results with the CoverageBrowser. Here we load the latest version of parser.csmes and compare it with the previous one (Tool --> Compare with...)
By inspecting the Executions window, we see that the speed issue is resolved. The execution time of the tests no longer grows exponentially.
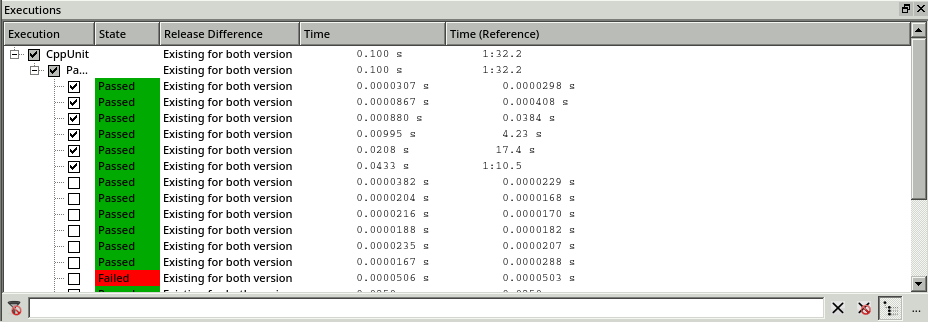
The Function Profiler window further confirms this finding. Coco highlights the modified functions in bold, underlines the new functions and strikes-out the removed functions. Now, by measuring the difference of the execution time (1 minute and 32 seconds), we can see that the performance gain is nearly the same as the previous execution time.
Conclusion
Using Coco's new profiling extension, it is possible to conduct a post-mortem analysis of the application's performance. This kind of offline analysis differs from many other profiling tools, which are typically more focused on getting profiling information only on the developer's computer.
Here it is possible to analyze the complete data set after a complete suite execution. Using the CoverageBrowser, it is then possible to select relevant tests, compare them, and, after code rewrites or refactoring, compare two software versions together. In other words, Coco allows us to execute a suite with the profiling data recorded, which we can archive or analyze later.


