Oh, here is more

Siemens PAVE360 | Built with Qt
Siemens Technologies and Qt Group work together on a virtualized HMI platform, enabling the OEMs and...
Watch Video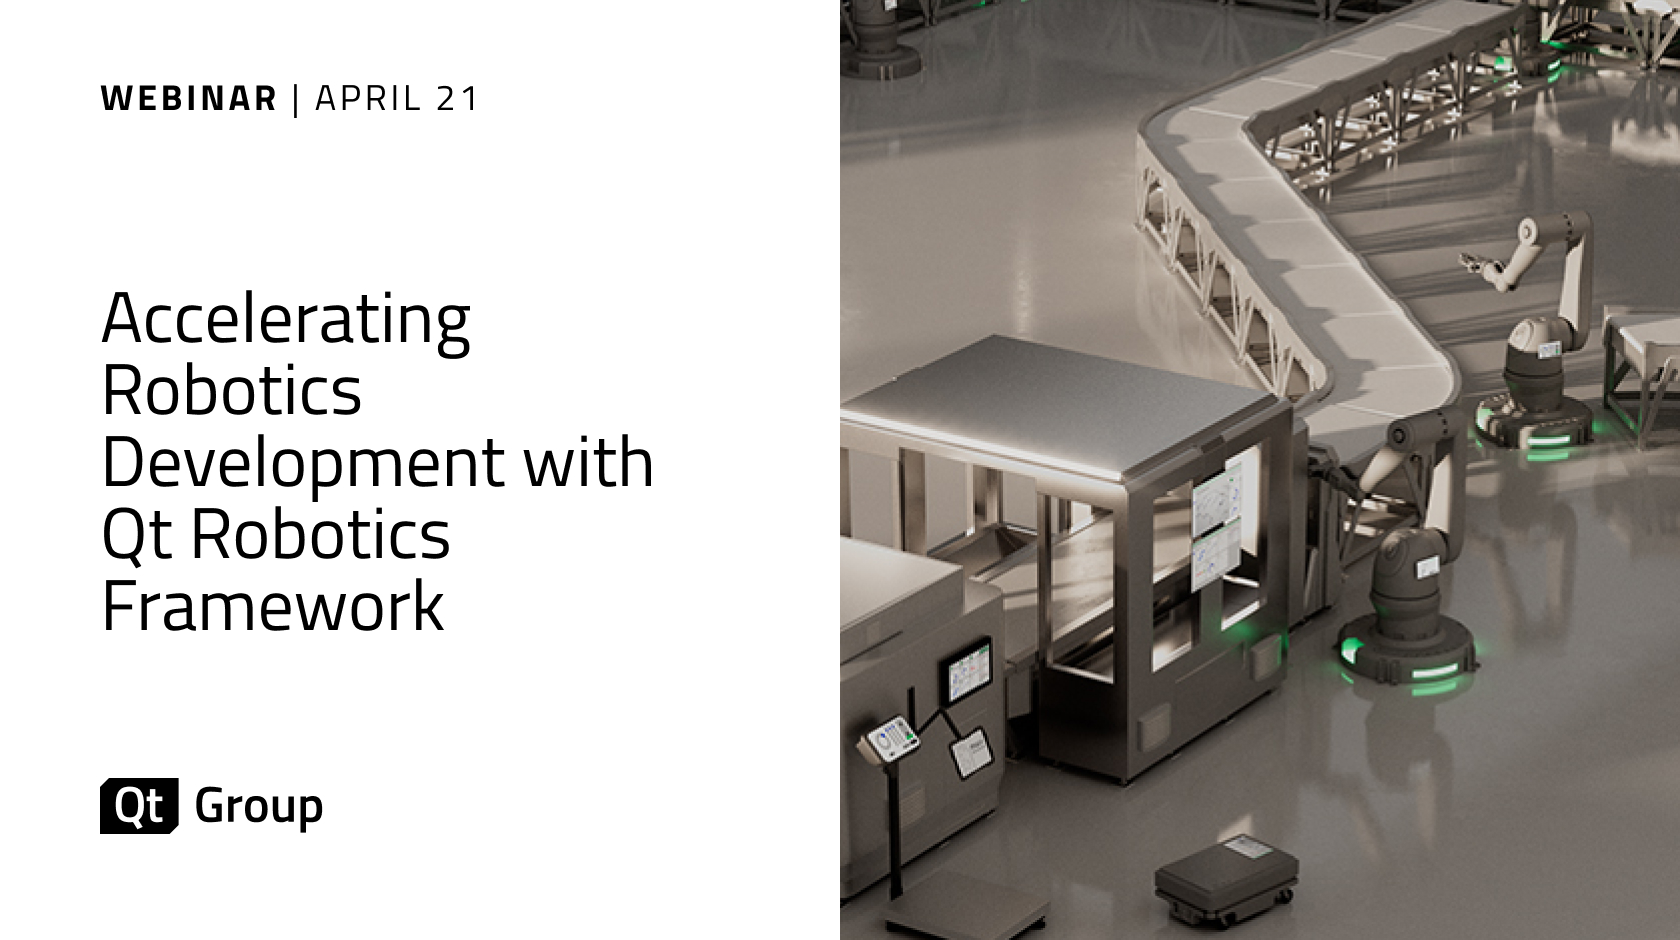
Webinar: Accelerating Robotics Development with Qt Robotics Framework
Qt Robotics Framework (QRF) introduces a fast, reliable way to connect Qt‑based applications (QML an...
Watch Video
Avilus | Built with Qt
Avilus is a manufacturer and certified operator of a new class of dual-use drones. Their unmanned ai...
Watch Video
Remarkable | Built with Qt
Remarkable uses Qt for its cross-platform capabilities, modularity, and flexibility. The UI is furth...
Watch Video