


.png)

Qt Framework
Build Better Software Faster
A comprehensive set of programming libraries and APIs for building complete cross-platform products with native performance.
Qt Framework gives the flexibility to combine a wealth of components:
USER INTERFACES | 3D & 2D GRAPHICS | GRAPHS | NETWORKING & CONNECTIVITY | DATA HANDLING | ACCESSIBILITY | CYBERSECURITY | FUNCTIONAL SAFETY
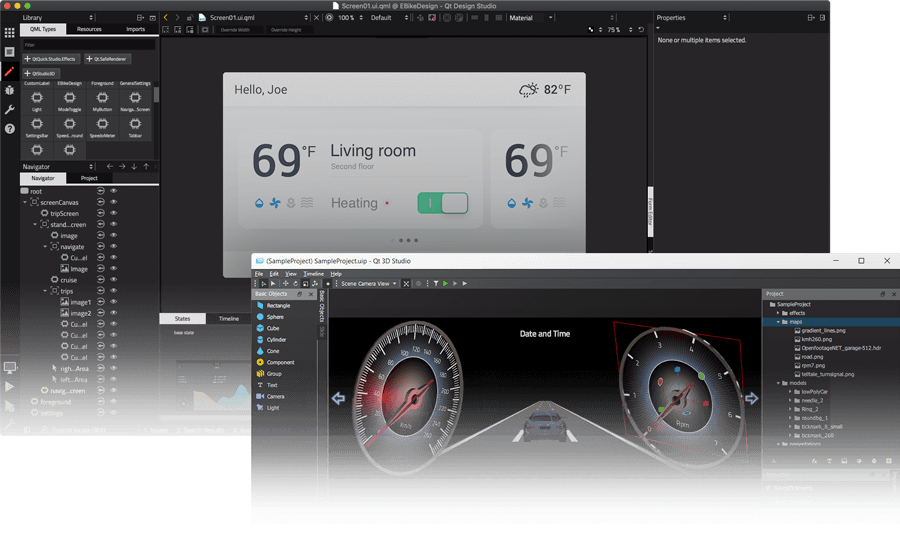
Development Tools
Developing with Qt Framework is possible using various Integrated Development Environments (IDEs) and a wide range of development tooling from coding, building, compiling, unit testing, localization, and more.
Explore Development Tools for Qt


Boost Your Productivity with AI:
Focus on Coding, Not Chores
Discover Qt AI Assistant in the Qt Creator IDE!
Skip the boring tasks, code more, and create faster.

Foilone | Built with Qt
Learn how Qt Professional Services helps the Marine Industry fast-track HMI development with out-of-the-box solutions that are deployed in a week whil...
Read More
CLEAN MOTION | Built with Qt
Learn how Qt Professional Services helps the Motor Vehicle's industry fast-track HMI development with out-of-the-box solutions that are deployed in a ...
Read More
Argotractors | Built with Qt
Argo Tractors delivers smartphone-like user experiences to their tractors, while reducing development time by 40% thanks to Qt.
Read More
Keurig | Built with Qt
Keurig's coffee machines provide a better brewing experience and cut development time with Qt Design Studio and Qt for MCUs.
Read More