May 19, 2022
This is the start of a series of posts where I'm going to share some insights on how to adjust a QML application to get the most out of qmlsc, the QML Script Compiler. In contrast to previous posts, I won't talk about the abstract architecture or the high level picture. You can read up on that in my previous posts. Rather, I'm going to show concrete pieces of code with concrete suggestions on how to change them.
Currently planned are posts on:
- Type Annotations for JavaScript functions
- Visibility of types at compile time
- Alternatives to Duck Typing
- Untangling Dependencies
- QtQuick.Controls and its Optional Imports
- The QML Import Path
- Unqualified Access to members of component root objects
The list may grow. I'm using the cutting edge features of Qt. Some of those may not even have been released, yet. In any case, I will always state the minimum version of Qt needed to apply the given techniques.
As mentioned above, we're going to get our hands dirty here. In order to do so, we first need to find a piece of software that provides sufficient dirt.
Qt Creator's QML Profiler has been around for a while and some may have forgotten about it. Let me assure you, it still does its job as it always has. You can measure the performance of your application, and crucially, it will measure any speedup gained by ahead of time compilation just fine. However, as a rather old QML application, the QML profiler GUI doesn't yet compile nicely to C++. Let's fix that. While we're at it, we can also use the QML Profiler itself to watch the effect of our improvements on the performance of binding evaluation.
I'm doing this with Qt Creator because that's a convenient target for such improvements. The techniques showcased here can be applied to any application, though. We won't achieve incredible performance gains on QML profiler because QML profiler's performance is limited either by I/O or by the internal data transformations implemented in C++, depending on the workload. However, I will still show how to directly observe the performance impact of any changes you make to your QML code.
First, let's set up our environment. What follows is a short guide on how to build Qt Creator and use QML profiler on itself.
How to start
The first step is simple: Install Qt and the Qt Quick Compiler Extensions from your Qt Maintenance Tool, clone the Qt Creator git repository, including its submodules.
You may checkout the master branch in order to avoid Qt compatibility-related compile problems, but mind that some of the changes we're going to do are already integrated in master. You can look at an older branch, for example 6.0, to see the original code.
Now open the CMakeLists.txt in Qt Creator. Choose a release-with-debuginfo configuration for the kit with the Qt version you have just installed. You should not try to build qml2puppet as that needs to be adjusted for every new version of Qt. We don't need it for what we are going to do here. In src/tools/CMakeLists.txt, remove the following line:
add_subdirectory(qml2puppet)
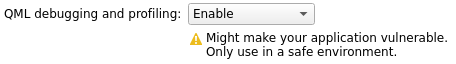
Now you need to enable QML debugging and profiling. The default application templates provided by Qt Creator do this automatically for debug and release-with-debuginfo configurations, but the Qt Creator build system is not created from such a template. To enable QML debugging and profiling, switch to the Projects mode and set the "QML debugging and profiling" dropdown to "Enable".

Then build. This already outputs some helpful warnings. In fact quite many. For example:
Warning: TimeMarks.qml:93:32: Unqualified access
                anchors.right: scaleArea.right
This is exactly what we want. We will look at them in detail, but first let's do a test run of the QML profiler and save an example trace. This is not a trace we're going to compare with other traces, but rather test data we will load back into the QML profiler in order to trigger the code we optimize.
Starting the profiler and saving a trace
Select the Debug view in Qt Creator, and "QML Profiler" in the dropdown.


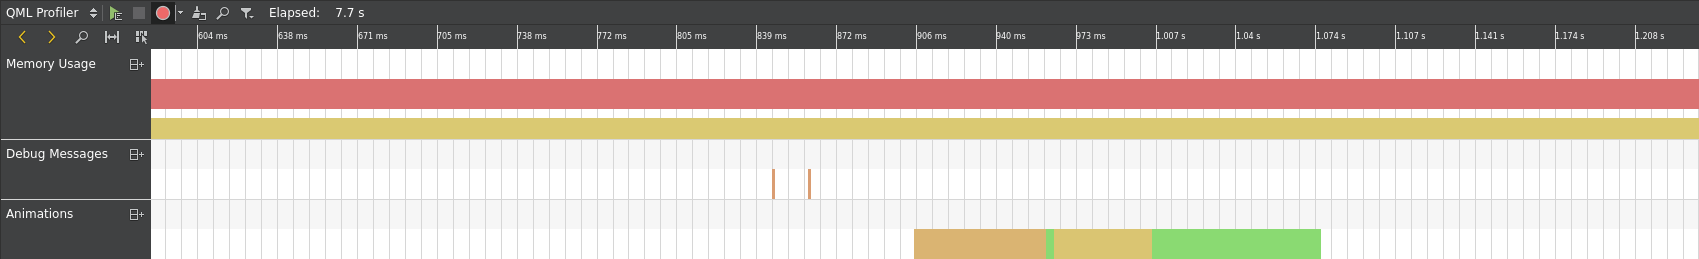
Press the green triangular "Start" button in the toolbar next to the dropdown. This will start another instance of Qt Creator, with QML Profiler recording a trace. You will notice that the "Elapsed" time starts ticking in the toolbar and all the views display a label that says "Profiling Application". Close the extra instance of Qt Creator. As a result, the timeline view will show a fairly boring trace with just a few events.
This is good enough for now. Right click in the time line view and, from the dropdown menu, choose "Save QML Trace". Choose a location and a file name for the trace. We will load it back later.
Finding your way around in QML Profiler
In quite a few places we get warnings like this:
Warning: ButtonsBar.qml:41:5: Could not compile function updateLockButton: Functions without type annotations won't be compiled
    function updateLockButton(locked) {
ButtonsBar.qml is the row of buttons in the upper left of the timeline view in QML profiler and Performance Analyzer. You can step through individual events and zoom the view with those. The function it complains about here is triggered when the "view event information on mouseover" button is toggled and the hover selection is enabled or disabled. Let's see how long that takes.
Start profiling Qt Creator as before, and switch to the new instance of Qt Creator that opens. Open the QML Profiler, right click in the timeline and "Load QML Trace" our example trace. Then toggle the "view event information on mouseover" button in the top left a few times.

Finally close the instance of Qt Creator being traced and switch back to the instance of Qt Creator that records the trace. There, you see a few more events in the timeline.
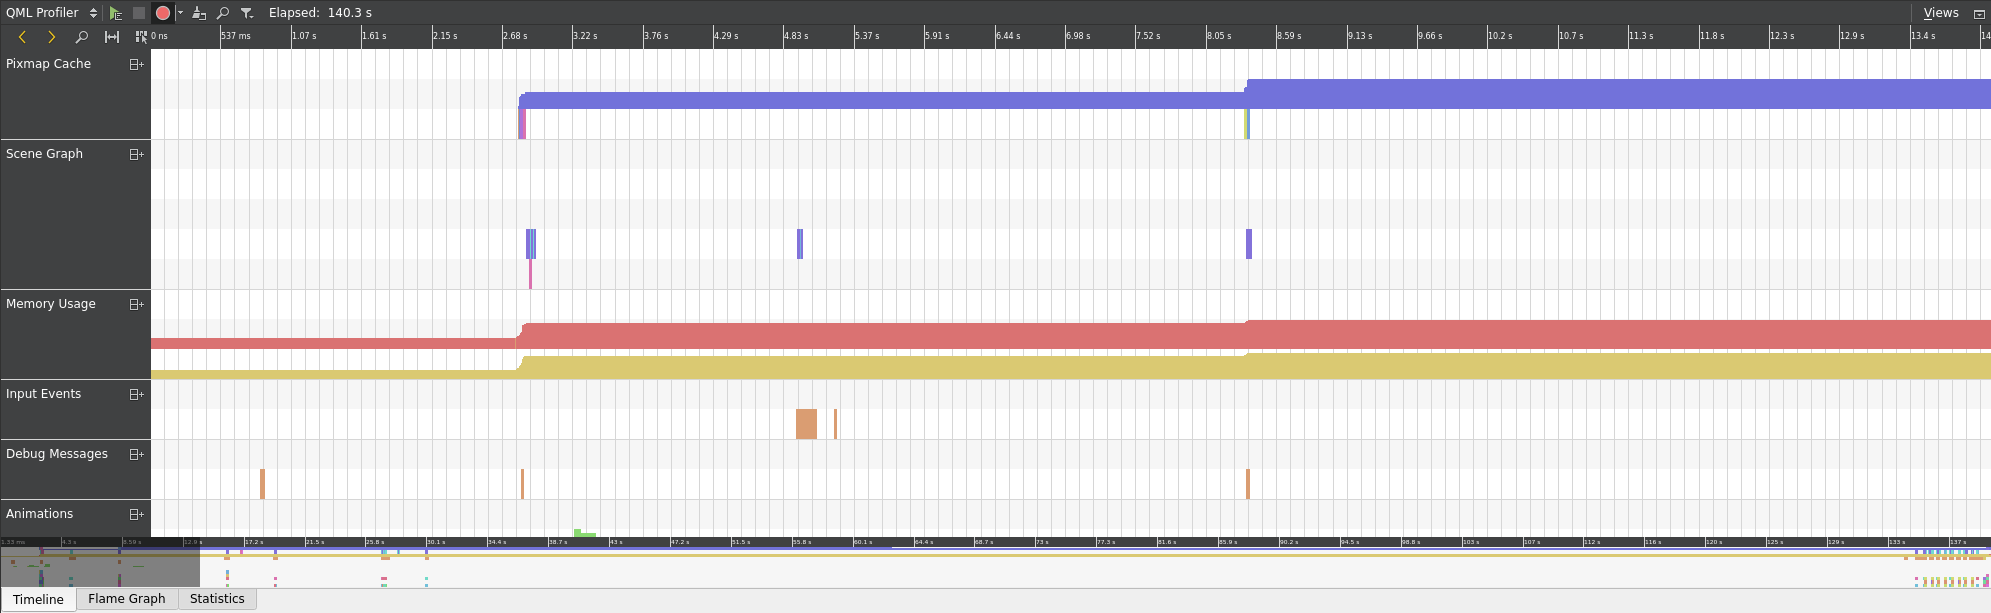
We're interested in the last part of the timeline. You can scroll the timeline using the overview on the bottom.
What we see there is a direct expression of our previous interaction with the application. The mouse clicks toggling the button are recorded as input events, and some of those trigger a cascade of bindings and JavaScript evaluation. (Note: You can re-order the event categories using drag-and-drop on the labels to the left of the timeline view.)
You can click the events to see information about them in a little information window. Qt Creator will also jump to the relevant source code if you do so. In a simple trace like this, the function we're looking for is easily found by just inspecting events in the timeline. It's the bottom-most JavaScript function at each of the input events. Clicking it gives you information on that specific invocation of updateLockButton(). You can see an aggregation of all events of the same kind, in this case all calls to updateLockButton(), in the Statistics view. The selections in all the views are synchronized. Therefore, just switching to the Statistics view takes you to the correct row already.
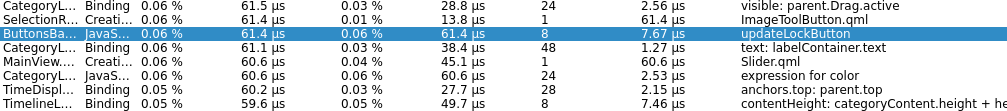
On my computer, the eight times I toggled the button took a cumulative time of 61.4µs, with each call taking 7.67µs on average. This is not a statistically significant measurement, of course. Yet, for demonstration purposes it's good enough.
Let's keep this number in mind until the next post in this series. Now that we have refreshed our memory on QML profiler, we can proceed to change the code and watch the effects achieved this way. In the next post I'm going to show what to do about those functions without type annotations.


