Calculating the financial value of software is not trivial, but it's not rocket science. Have you ever been in the position to justify your software purchase to your CFO or the procurement team? I've been doing this many times throughout my career in different product management and R&D leadership roles. The MAKE or BUY decision is often on the table. We at the Qt Company want to help current and future customers turn the benefits of using Qt's commercial software into financial outcomes. Therefore, we developed a tool that calculates the ROI of using the different parts of our portfolio and helps to surface current challenges and their business impact. In the past, I’ve been using Microsoft Excel to do the math of how much money we can save and how much additional money we can make by using a particular software. Using Excel in a world of cloud-based solutions felt a bit outdated, and we decided to build the new Qt Value Assessment Tool on an interactive web-based platform.
This blog post describes how we help customers to translate typical software development challenges into tangible financial benefits with Qt's Value Assessment Tool. This blog post outlines which impact Qt's software has and how we calculate the Total Cost of Ownership over several years.
Challenges and Benefits
When we talk with our customers, we always try to understand the pain points first. Every software development project has specific challenges. No project is like the next one. But there are common challenges which we hear from our customers. When we assess the value of Qt, we start by going through the common challenges. We try to understand which of these challenges the customer faces and how much, in relative terms, they impact their business.
Common challenges include but are not limited to:
- Wasting effort by working in siloed organizations and disconnected toolchains
- Burning a lot of resources to support the same product on different operating systems and/or hardware configurations
- Spending a lot of developer resources on creating basic software code which every application has
- Coding software without embedded spell-checking, live previews, code performance analysis, and debugging tools for the chosen programming language
- Breaking APIs from the UI or application framework or other open source components
- Chipset shortage and inflexible chipset technology procurement
- High software developer turnover
- Time to Market pressure from management and competitors
We lead this dialog by rating the business impact of each challenge as shown below:
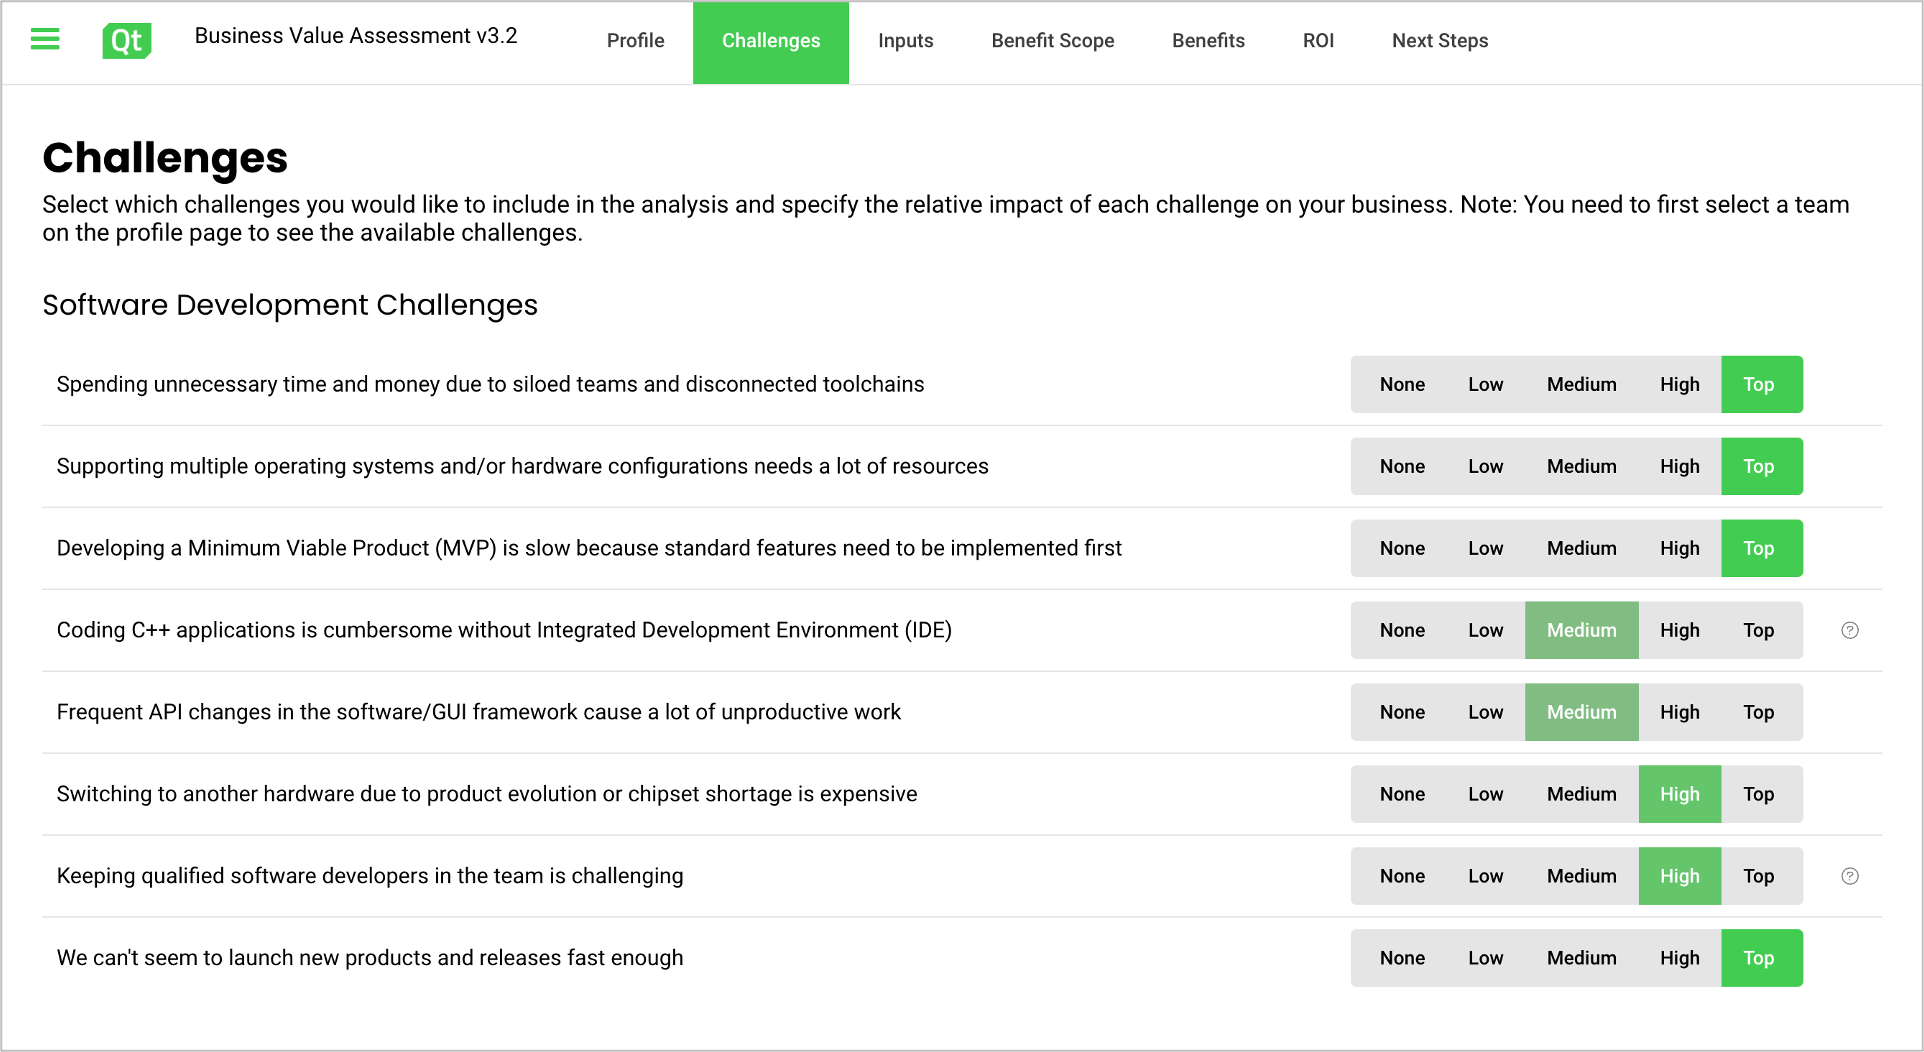
Image: For illustration only - Challenge Rating in the Qt Value Assessment Tool
We then continue the assessment by collecting the input values for the relevant challenges. The key inputs include parameters such as the number of developers, the average salary of different employee groups, and how many dedicated teams work on different target platforms. We also discuss detailed input figures such as how much time it typically takes to turn a UI design into a functional UI, boot an application on the new target hardware, or fix a breaking API. Based on the rating of the development challenges, we adjust between 5 and 20 input values, all of them having example values based on Qt's vast experience in cross-platform development.
Annual Benefits
The next step is to turn challenges into solutions and corresponding annual financial benefits. This is done through some good old fashioned number crunching, as shown below:
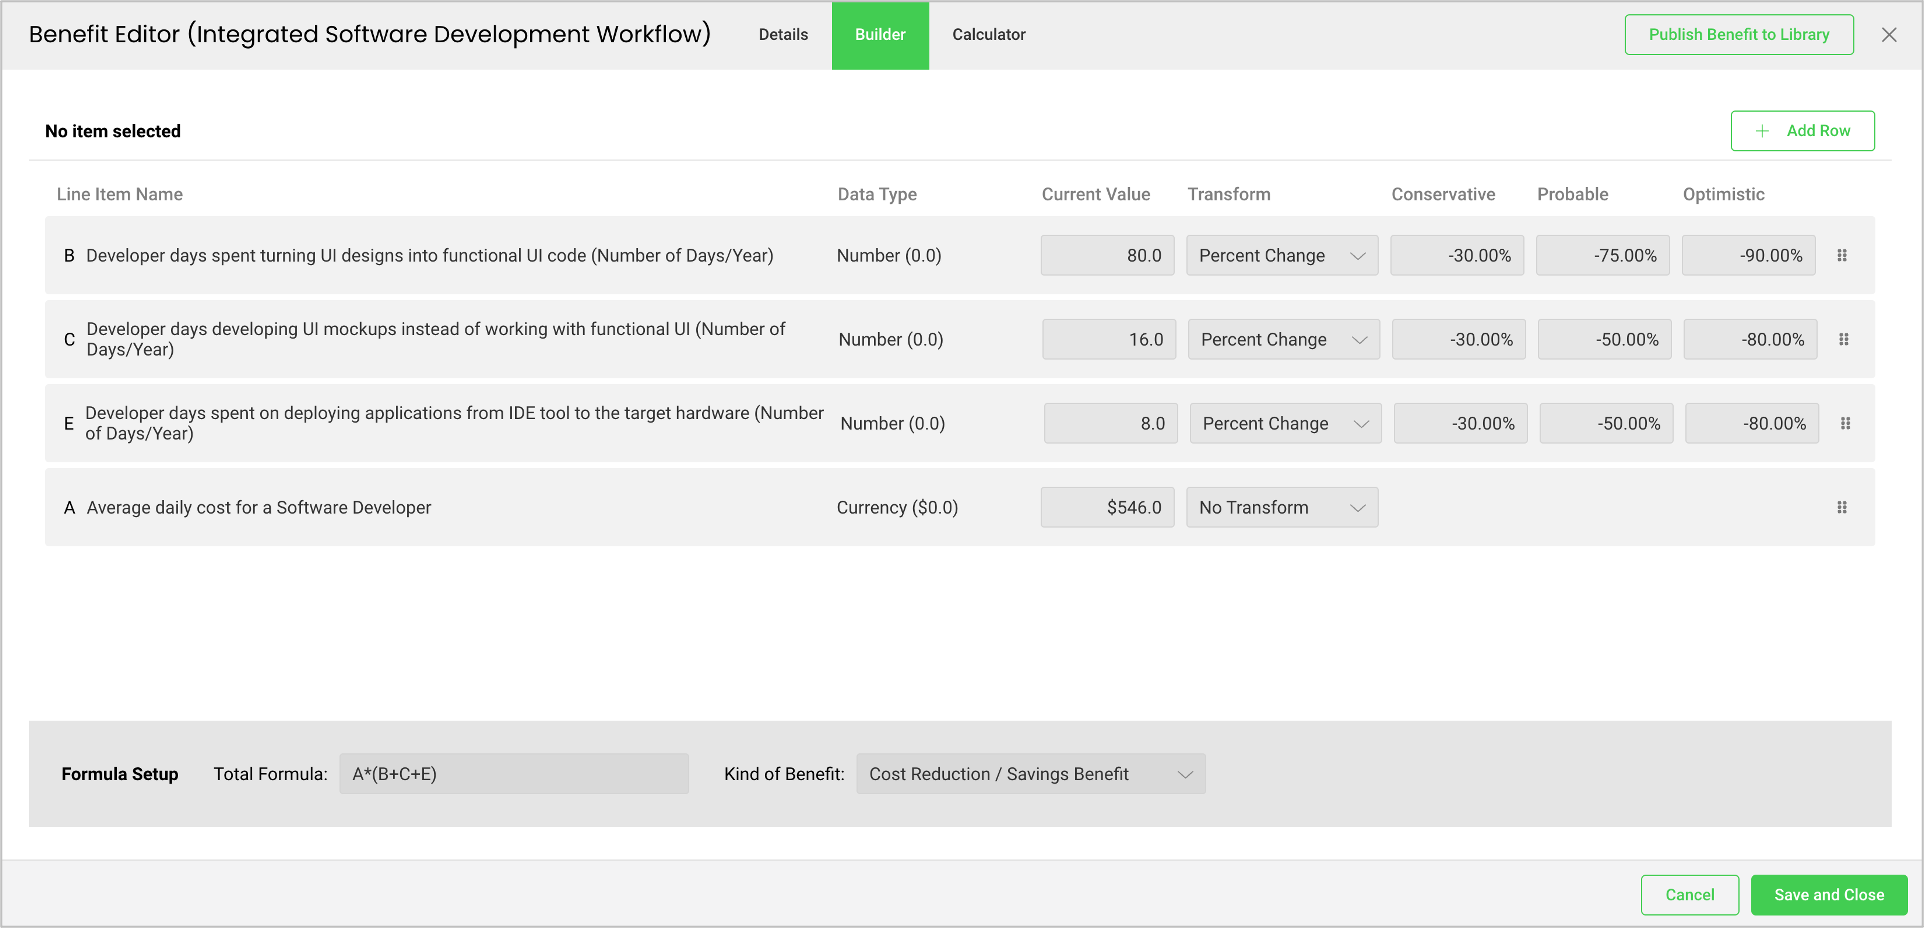
Image: For illustration only - Example calculation of the value of a benefit
We do have one benefit calculation for each challenge rated earlier in the process. As mentioned before, these calculations are not rocket science. However, we have noticed that translating challenges into benefits can create more awareness of specific pain points. An essential task is to find an appropriate impact figure during a value assessment. The ROI calculation is very sensitive to the impact figures, which are the core of the BEFORE/AFTER comparisons. Here we try to find an impact figure the customer or prospect is comfortable with. We do offer scenario analysis as part of the value assessment, but more importantly, we spend a lot of time on the probable scenario.
One needs to be aware that the ROI calculation works with the concept of cost savings as a quantitative measure. For most, if not all, customers, this doesn't mean money in the bank because the amount of software developers isn't changing in the mid-term. Still, more resources are available for other strategic initiatives.
Once we have gone through all benefits, we understand the annual benefit of using Qt.
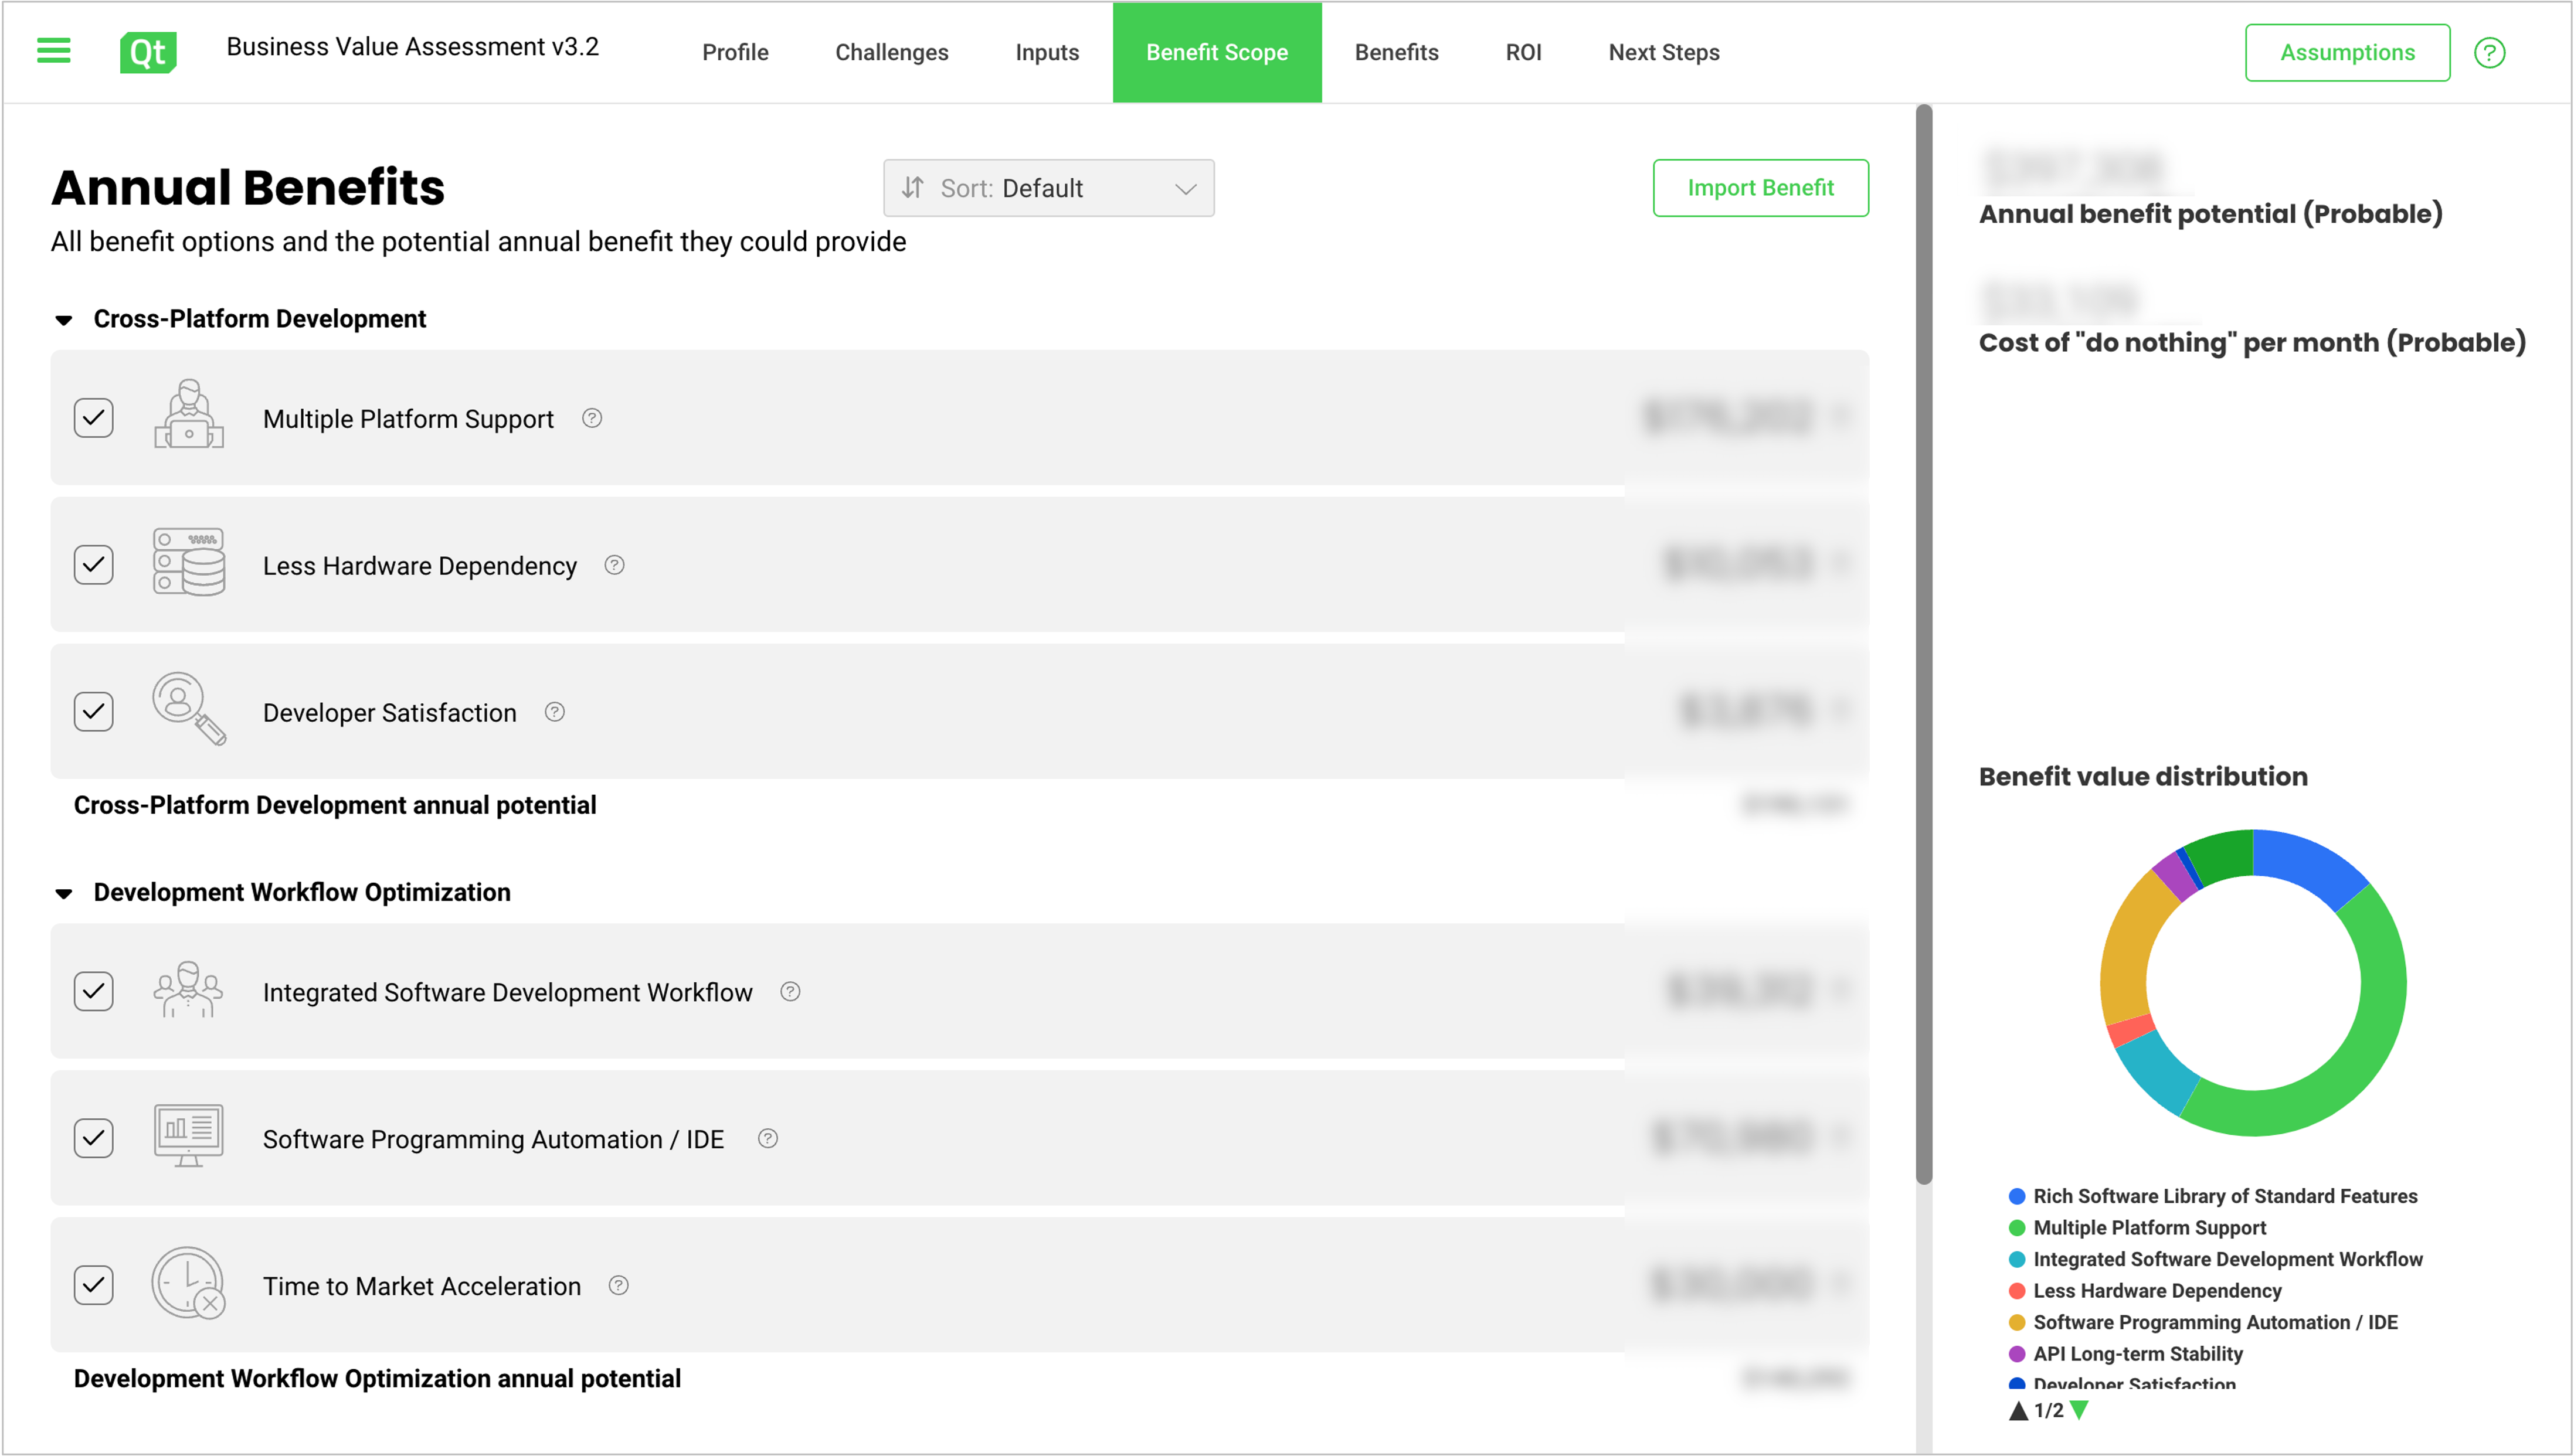
Image: For illustration only - Annual benefits overview in the Qt Value Assessment Tool
Investments
The benefits are then matched with the different investments related to the commercial software. The investments consist of developer-based subscriptions, unit-based royalties (if Qt is used for embedded devices), professional services (if any), own development expenses (if required to modify code to embed Qt), professional training (if any), and legal services related to the commercial agreement with the Qt Company. The investments can be entered for the projected calculation period for the ROI analysis.
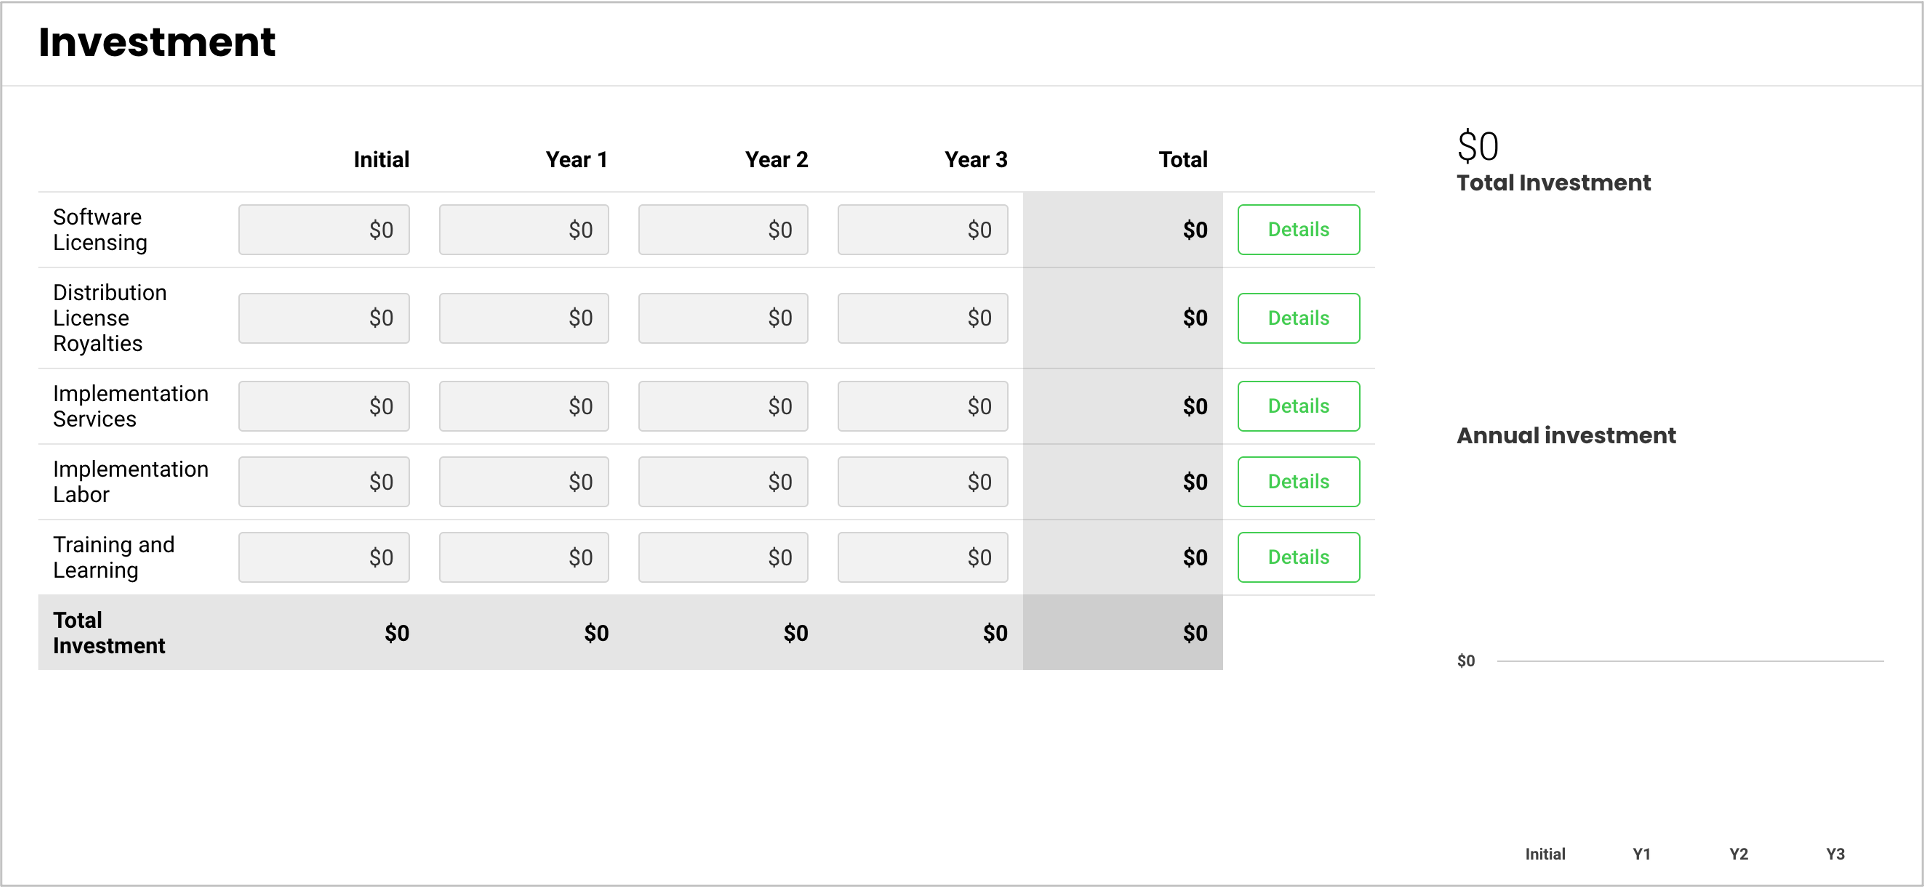
Image: For illustration only - Investment form in the Qt Value Assessment Tool
ROI over Time
The final step is to calculate the ROI over time. We typically work with a three-year subscription period, but we can adjust to anything between one-year to five-year assessment periods. The Value Assessment Tool will calculate the ROI, the payback period, the NPV, and the Internal Rate of Returns.
To make the analysis more realistic, we do work with annual realization values for the financial benefits. It would be unusual that the benefits come through 100% from Day Zero. Ramp-up, organization arrangements, and the learning curve impact how the benefits are realized. We might start with a 3-month delay from the project start, begin with a realization percentage of 25% in the first year, and grow over the following years to 100%.
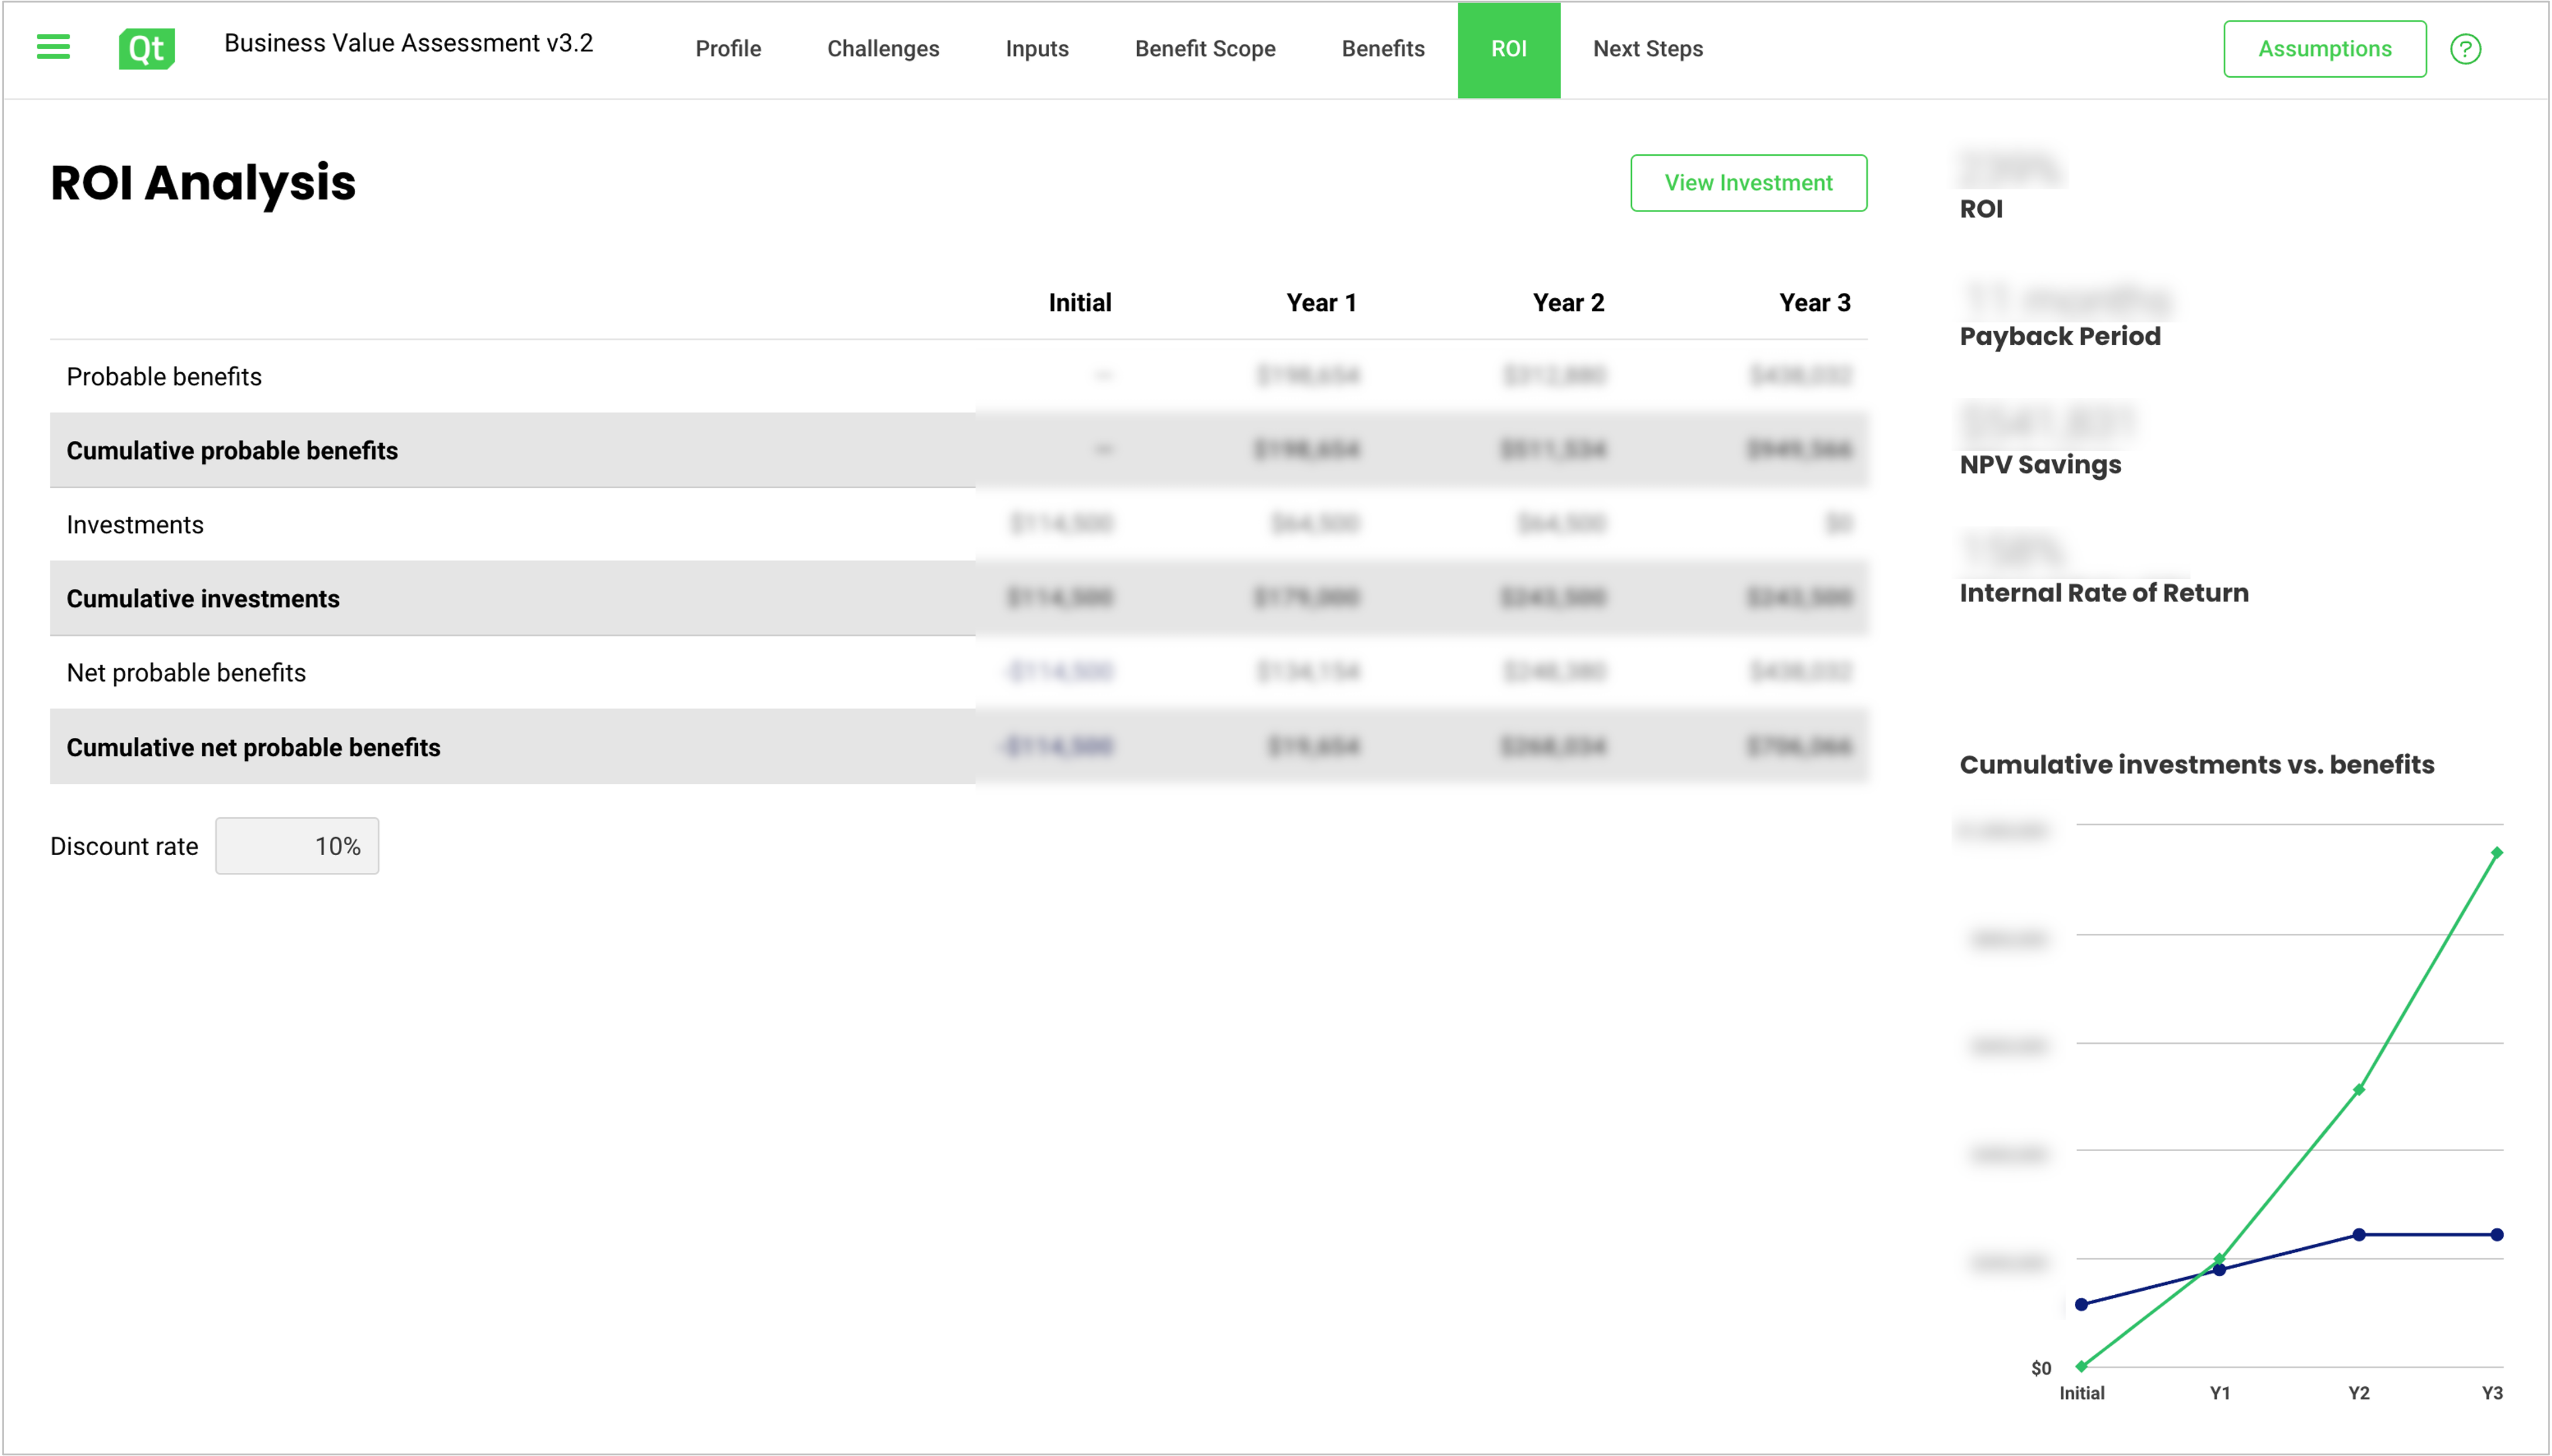
Image: For illustration only - Example ROI calculation in Qt Value Assessment Tool
The final step of the value assessment is to automatically generate a report of the findings in either PowerPoint or PDF format.
Overall, the calculation of the ROI of Qt cross-platform software takes a few hours to complete. Preparation for the detailed input values accelerates the assessment. The process of the value assessment is not linear. It is essential to do enough iterations of the input values, annual benefit calculations, and the realization percentages until the customer is comfortable that the outcome is realistic.
Qt Value Assessment is a powerful tool for creating a shared understanding of the challenges and potential benefits of using Qt software. No single analysis is the same. Every customer is different.
If you are considering Qt and are interested in running a value assessment, please contact us.