With the release of Qt 6.10 in October 2025, it's time to take a look at what new and improved features QtGraphs has to offer.
Major Features and Improvements
Filled Surfaces
Before, 3D surface graphs could only display a thin surface layer. Qt 6.10 introduces the ability to fill the area beneath a 3D surface, making the graph appear as though the surface is solidly filled from the base to the top layer.: https://doc.qt.io/qt-6/qsurface3dseries.html#DrawFlag-enum. The fill even supports gradients, just like surfaces themselves.
Using the filled surface is as simple as setting the flag for the series you want to enable it for:
Surface3DSeries {
    id: oceanSurface
    drawMode: Surface3DSeries.DrawSurface | Surface3DSeries.DrawFilledSurface
    shading: Surface3DSeries.Shading.Smooth
    colorStyle: GraphsTheme.ColorStyle.RangeGradient
    baseGradient: Gradient {
        GradientStop {position: 0.0; color: "#ff000033"}
        GradientStop {position: 1.0; color: "#6600ffff"}
    }
}
Better Support for Injecting Graphs to QtQuick3D Applications
In Qt 6.9, we introduced a simple way to inject 3D graphs into QtQuick3D applications using the importScene property of View3D. In Qt 6.10, we have taken this even further by introducing Bars3DNode, Scatter3DNode, and Surface3DNode: https://doc.qt.io/qt-6/qml-qtgraphs-bars3dnode.html. By using these instead of the importScene, it is possible to add the nodes to a View3D directly, just like you would add any other QtQuick3D Node, such as a Light or a Model.
Using this is straightforward, as can be seen in the following code snippet:
View3D {
    ...
    Scatter3DNode {
        id: satellites
        theme: GraphsTheme { id: graphTheme... }
        Scatter3DSeries { id: scatterseries... }
    }

    Model {
        id: earth
        source: "meshes/sphere_mesh.mesh"
        materials: [
            earthMaterial
        ]
    }
    ...
}
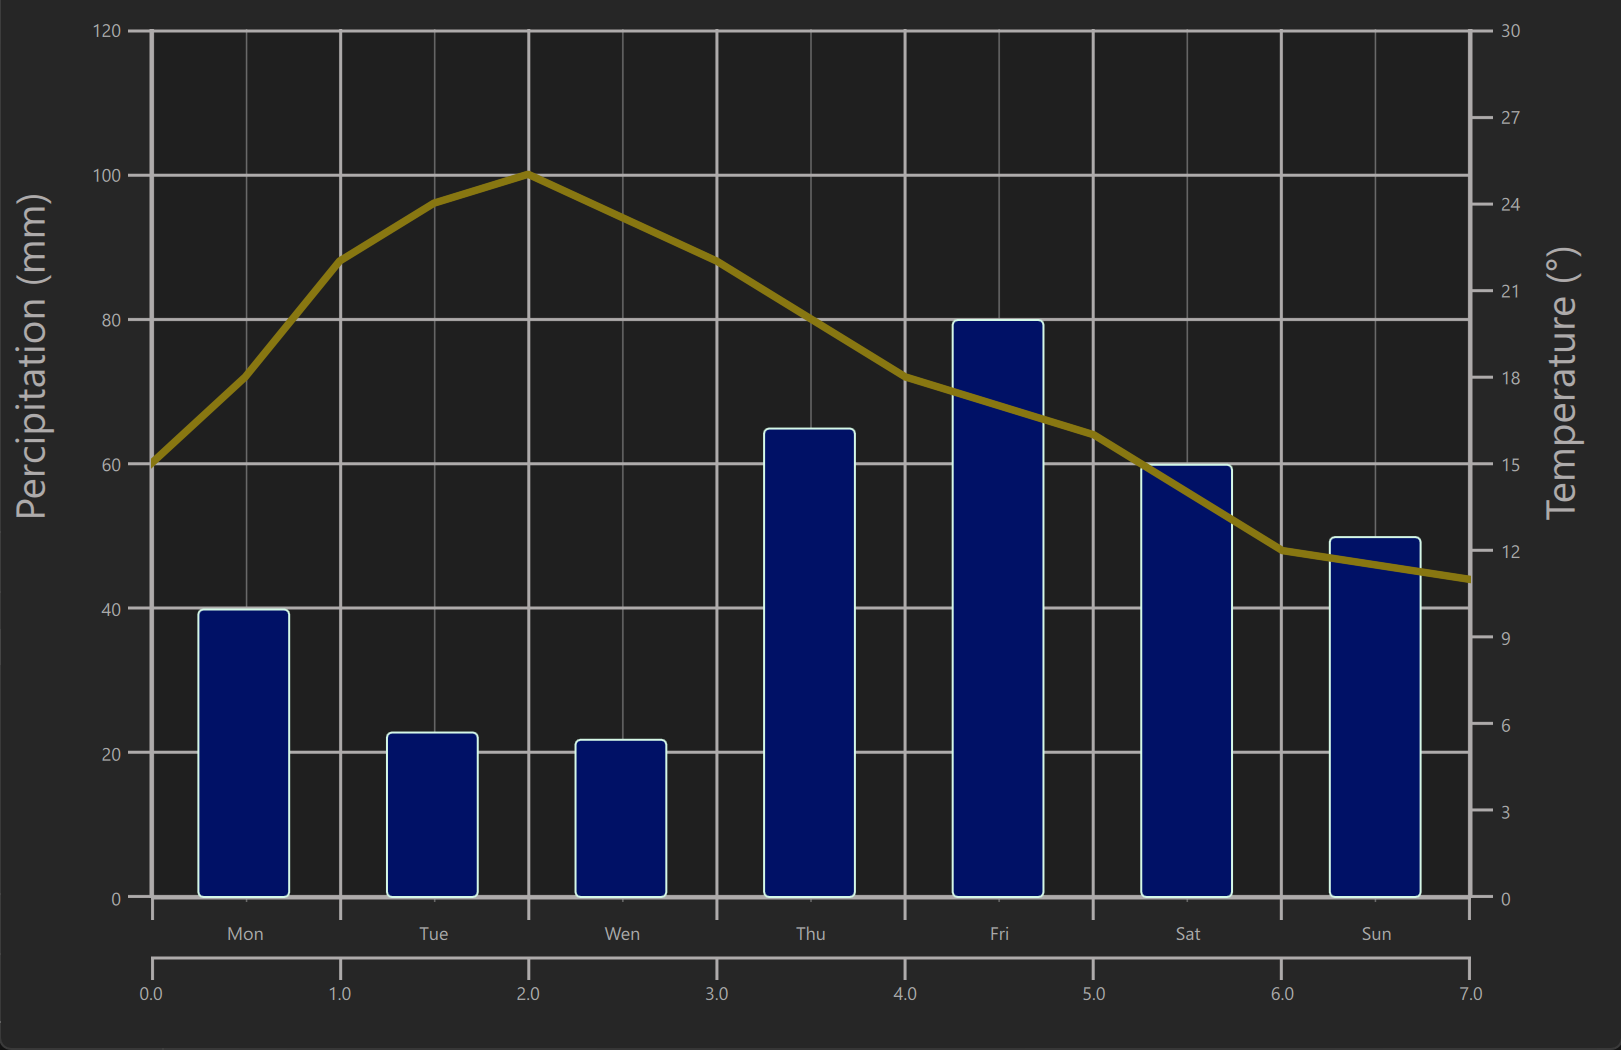
Multi-axis Support for 2D
Before, there was no possibility to add additional axes into 2D graphs, for instance for the purpose of displaying two different graph types with different values in the same GraphsView. In Qt 6.10, we added support for defining more than one both horizontal and vertical axis.
GraphsView {
    ...
    axisX: BarCategoryAxis {
        id: xAxis
        categories: ["Mon", "Tue", "Wen", "Thu", "Fri", "Sat", "Sun"]
    }

    axisY: ValueAxis {
        id: yAxis
        max: 120
    }

    BarSeries {
        id: percipitationSeries
        ...
        BarSet {
            label : "Percipitation"
            values : [40, 23, 22, 65, 80, 60, 50]
            color: "#001166"
        }
    }

    LineSeries {
        id: temperatureSeries
        ...
        axisY: ValueAxis {
            id: axisY2
            max: 30
            alignment: Qt.AlignRight
        }
        axisX: ValueAxis {
            id: xAxis2
            max: 7
            tickInterval: 1
        }
        ...
    }
}
Rendering a Slice into an Image
There already was support for rendering the graph itself into an image, but we were lacking the support for rendering a slice view to an image in surface and bar graphs. Now that has been remedied.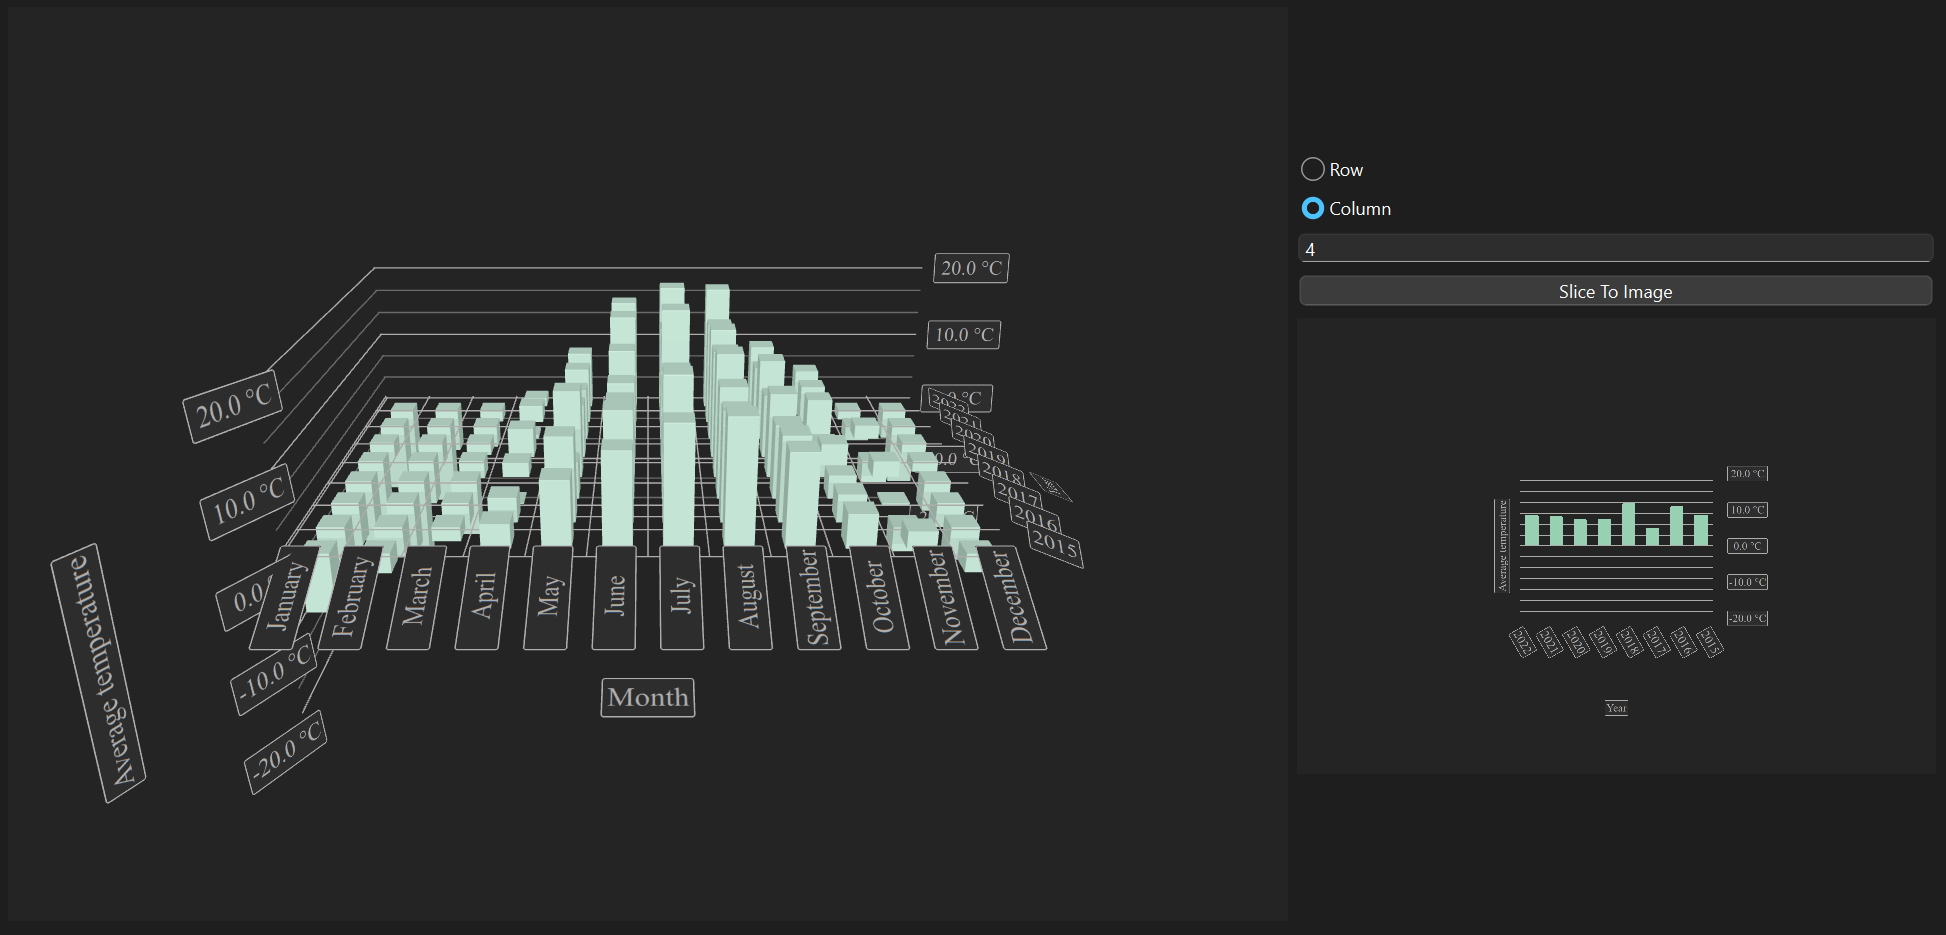
In C++ we can get the image directly by connecting to a signal:
void BarGraph::renderSliceToImage()
{
    int index = m_lineSelectText->text().isEmpty() ? -1
               : m_lineSelectText->text().toInt();
    QtGraphs3D::SliceCaptureType sliceType = m_rowRadioButton->isChecked()
                                            ? QtGraphs3D::SliceCaptureType::RowImage
                                            : QtGraphs3D::SliceCaptureType::ColumnImage;

    connect(m_modifier, &BarGraphModifier::sliceImageChanged, this,
            [this](const QImage &image) {
        m_sliceResultLabel->setPixmap(QPixmap::fromImage(image));
    });
    m_modifier->renderSliceToImage(sliceType, index);
}

void BarGraphModifier::renderSliceToImage(QtGraphs3D::SliceCaptureType sliceType,
                                          int requestedIndex)
{
    m_graph->renderSliceToImage(requestedIndex, sliceType);
}
In QML, we need to save the image to be able to use it, as there is no way to use the item returned by the signal directly as an Image or a source to an Image. In the snippet below we have added a FileDialog for selecting the file to save the image to:
...
id: controls
property url selectedFile: fileDialog.selectedFile

FileDialog {
    id: fileDialog
    currentFolder: StandardPaths.standardLocations(StandardPaths.PicturesLocation)[0]
    fileMode: FileDialog.SaveFile
    selectedFile: controls.selectedFile
    onAccepted: {
        controls.selectedFile = selectedFile
    }
}

Button {
    text: "Slice To Image"
    onClicked: {
        var rowCol = rowRadio.checked ? Graphs3D.SliceCaptureType.RowImage
                                      : Graphs3D.SliceCaptureType.ColumnImage
        var index = textField.text
        barGraph.graph.renderSliceToImage(index, rowCol, controls.selectedFile);
    }
}

...
Smaller Improvements
Text Eliding
Eliding text for 2D axis labels was missing, causing long labels to overlap and become potentially unreadable. Support for this has now been added.
Visibility Control for Small Pie Slice Labels
With small pie slices, the labels can overlap and become hard or impossible to read. Support for hiding labels under certain size has been added, and the hiding logic can be adjusted to your needs.
Hover Detection Support
2D graphs now support detecting if a series is hovered on. This makes it easy to for instance highlight a certain series in the graph, or even change the draw order (another new feature in Qt 6.10 looked into a bit further on) based on what is being hovered.
Plot Area Clipping Support
Support was added for optionally not clipping the plot area, if items are partially outside of it: https://doc.qt.io/qt-6/qml-qtgraphs-graphsview.html#clipPlotArea-prop
Query Data Point Coordinates
It is now possible to query data point coordinates in a LineSeries based on render coordinates: https://doc.qt.io/qt-6/qlineseries.html#dataPointCoordinatesAt
MouseArea {
    anchors.fill: graphView
    onClicked: {
        queriedPoint = lineSeries.dataPointCoordinatesAt(mouse.x - graphView.plotArea.x,
                                                         mouse.y - graphView.plotArea.y)
    }
}
Draw Order Customization
Setting the draw order for 2D graphs within the same GraphsView can now be customized. In the following video clip the draw order brings the currently hovered graph to the front.
Categorized Logging
Finally, we have added support for categorized logging, making it easier to receive log messages only of the areas you are interested in, if at all.
Conclusion
The Qt 6.10 release brings significant advancements to QtGraphs, enhancing both functionality and developer experience. With the introduction of filled surface rendering, multi-axis support for 2D graphs, and new node types for seamless integration into QtQuick3D applications, visualizing complex data is now more flexible and intuitive. Enhancements such as precise slice image rendering, improved label management, and expanded user interaction options enable developers to create more dynamic and informative user interfaces.