The Test Center team is happy to deliver the next major release of Test Center, version 3.0, offering support for Squish Coco coverage reports. You can now browse and analyze your code coverage reports right next to your test reports stored in Test Center.
Coco Code Coverage Integration
In the past, you either had to use the Coco Coverage Browser, or generate a Coco HTML report to get a good overview of your Coco coverage results. With Test Center 3.0 most information provided by the Coverage Browser and HTML report can now also be accessed via your Test Center instance, simply by uploading the csmes and csexe coverage result files generated by Coco. The imported coverage reports will become accessible from within the existing result views in Test Center.
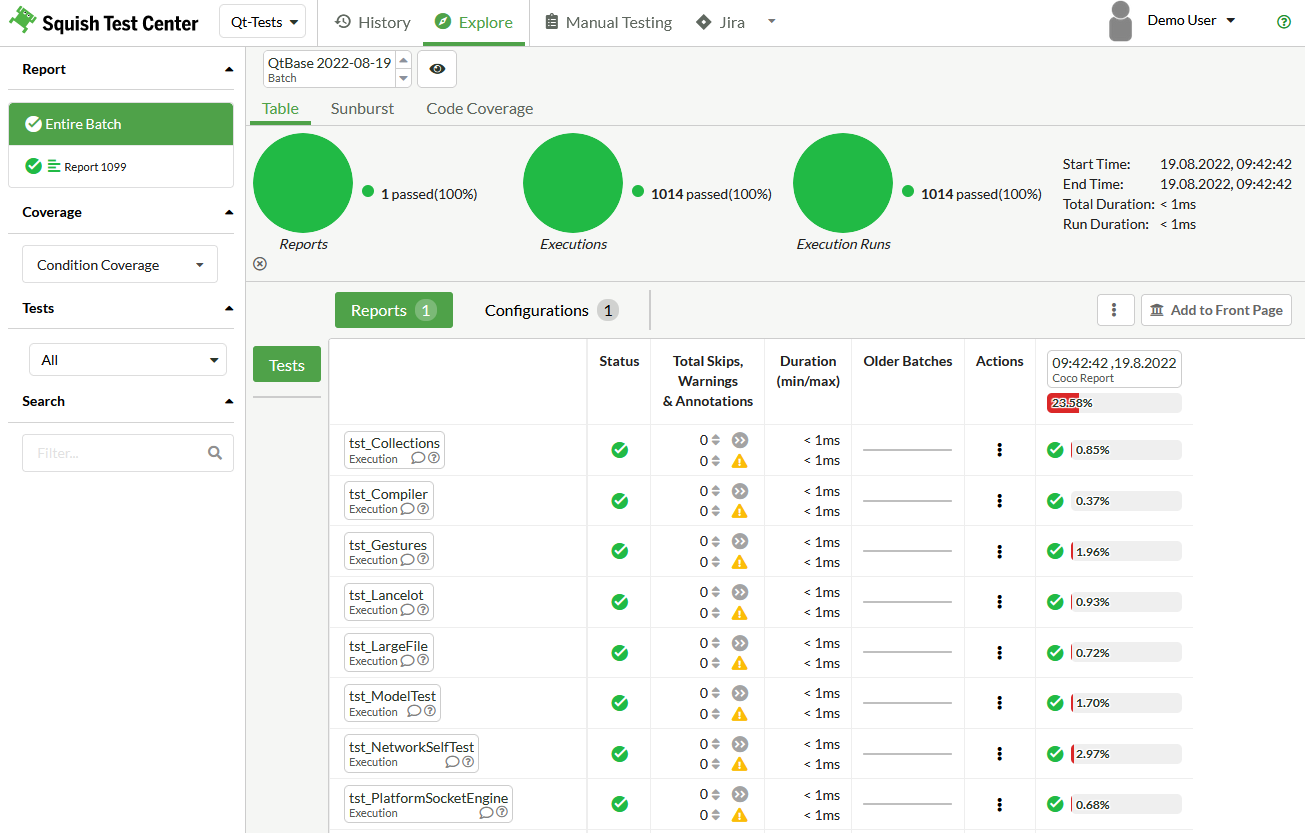
Coverage displayed within the explore view
In this first iteration we added support for the following features:
- Support for all coverage methods supported by Coco
- Providing eLOC and McCabe statistics for files, folder and functions
- Displaying coverage results for test executions
- Showing coverage results for files, folders and functions in a new Code Coverage tab added to the Explore View
- A source code view that highlights the coverage status of individual source code lines
- Truth tables that show the covered condition states
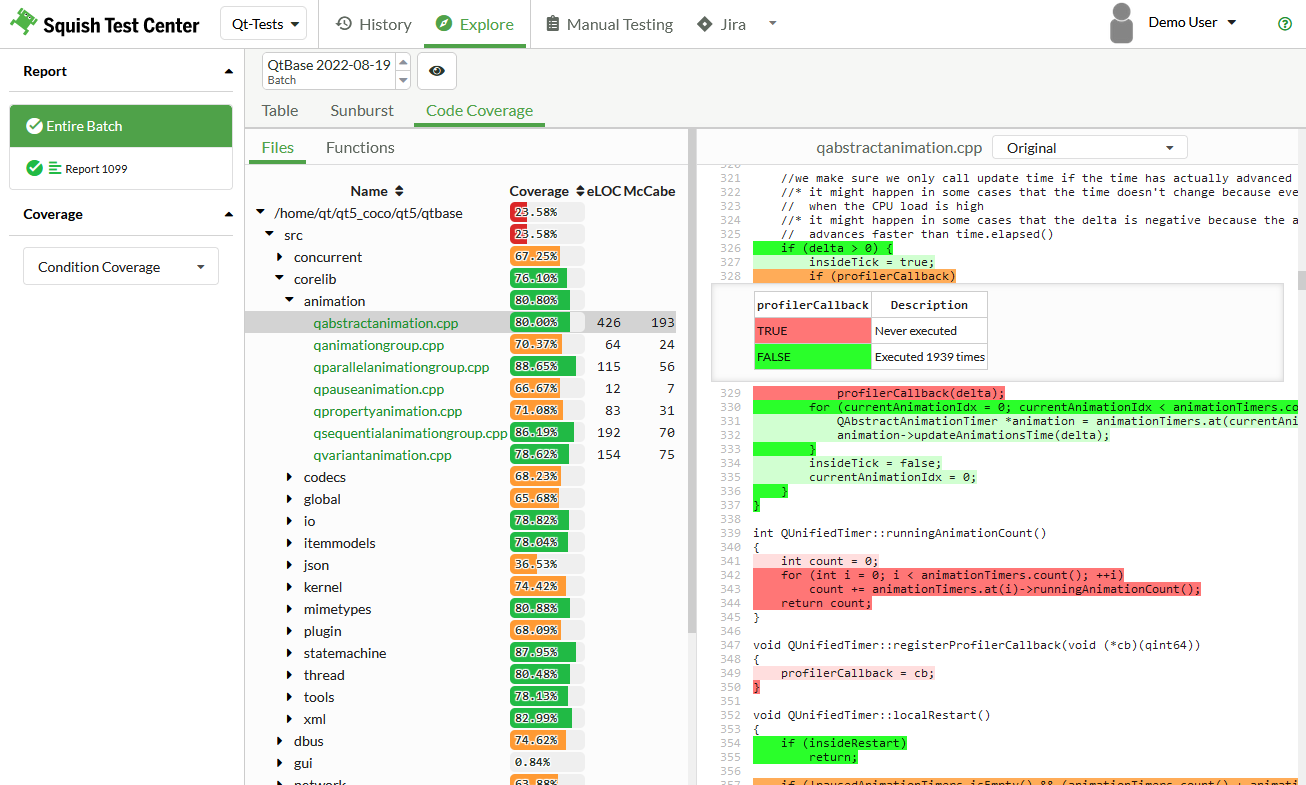
Source code coverage and truth tables for conditions displayed in new Code Coverage tab within the Explore View
Just like in the Coverage Browser, you can easily switch between the different coverage methods at any time or even view different coverage metrics side by side in the graph view.
On top of that, you can now also easily track your coverage statistics over time, as you can access all previously uploaded coverage reports just as easily as you can access the most recent reports. We have integrated the coverage values in our timeline where you can see how your total coverage developed over multiple test runs, and you can also look at the coverage of individual test cases or scenarios over time. The coverage values can also be analyzed in the graph view, where you can see how your coverage improved over time. It allows to combine all available coverage statistics and also allows to look at how the effective lines of code have changed in comparison. When limited to a single test run you can also use it to compare how tests fare against each other.
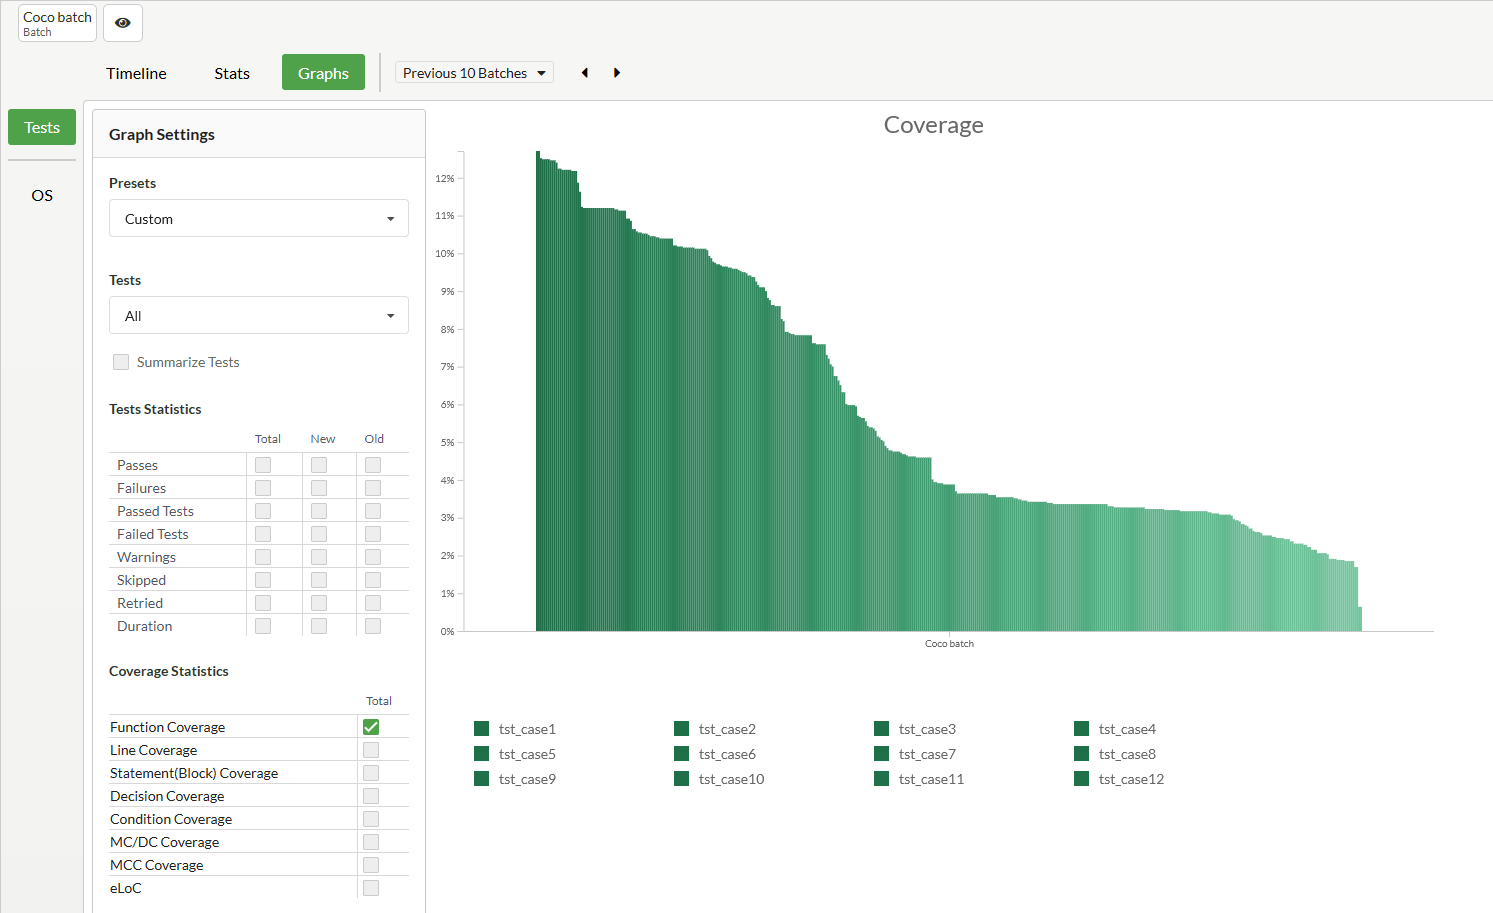
Coverage statistics in the graph view
As Test Center now offers a central storage for your coverage results, you also no longer need to worry about distributing the coverage reports among colleagues.
This new version of Squish Test Center is available for download now.