Qt Debugging & Profiling
Qt Debugging & Profiling – The developer experience with productivity at its core. From development through to testing and maintenance Qt’s got you covered for every step in your product life-cycle. Learn more about our tooling to debug and profile your applications. Qt Quick Compiler: • Compile QML source code into native machine code • Faster start up time & UI performance • Protect your source code and intellectual property Qt Quick Profiler: • Advanced performance analysis of your application • Identify and fix performance bottlenecks • Remote debugging & profiling Clang Static Analyzer: • Find issues by source code analysis • Identify bugs before your customers do Qt Test Runner • Build and run autotests for your projects • Make unit testing part of your development process • Ensure high quality code Visit www.Qt.io to learn more about Qt.
Oh, here is more

On-Demand Webinar: Agentic Development for Embedded Devices: From Experiment to Production
Agentic development for embedded devices is moving from experiment to production, and regulated indu...
Watch Video
CRA-ready in der industriellen Automatisierung: Von der Entwicklung bis zur Integration
Industrielle Softwareteams arbeiten unter zunehmendem Druck - knappe Budgets, CRA-Compliance-Fristen...
Watch Video
Video Podcast: Five Things From Auto China 2026 That Should Change Your SDV Roadmap
The modern in-vehicle experience starts in the architecture underneath the cockpit. The world’s bigg...
Watch Video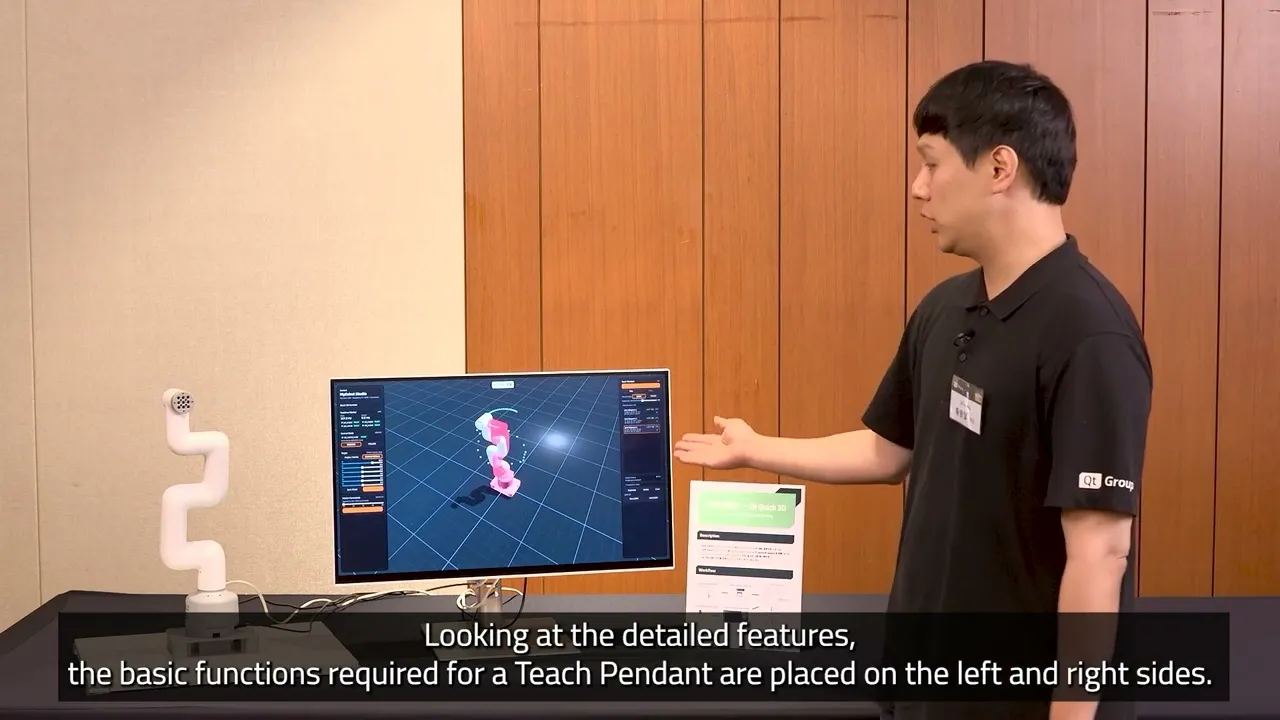
URDF to QML: Prototyping a Teach Pendant App with Qt Quick 3D
In this demo, Eric Hwang, Business Development Engineer, shows how to build a Teach Pendant by conve...
Watch Video