
Qt Graphs: A New 3D Graph Rendering Module with Kwanghyo Park | #QtWS23
Abstract: We are introducing a new Qt module to draw 3D graphs. It is a new generation of an existing module called Qt DataVisualization. In this talk, I would like to share why Qt provides a new 3D graph module, what makes it different from the old one, and the new module's goals.
About the Speaker: Kwanghyo Park has 10 years of experience in Software engineering with various development backgrounds. Currently mainly focusing on Qt 3D graphics development.
Oh, here is more
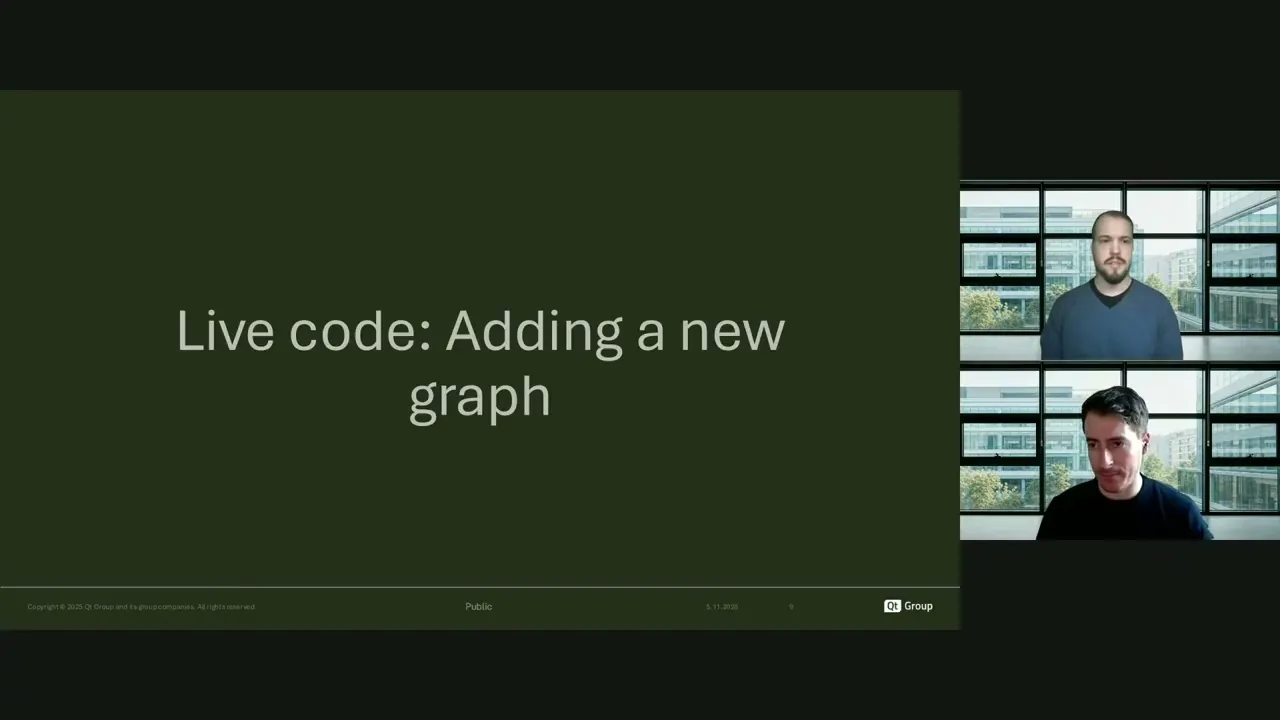
On-Demand Webinar: From Rectangles to Shader Effects: How Controls, Graphs and Everything Between Works Together
A hands-on look at Qt's UI framework. Discover how to combine basic controls, animations, graphs, an...
Watch Video
On-Demand Webinar: Designing for Real-World Devices: Why Is It a Field of Its Own and How Qt Is Tackling the Most Complex Design Challenge
In this keynote, we discuss UX design for real-world devices and why we believe it needs solutions t...
Watch Video
On-Demand Webinar: Modern, Performant UIs to Rust and C#: Qt Bridges Technology Preview Is Here!
Qt Bridges brings Qt to the languages your team already writes. This session covers the project and ...
Watch Video
On-Demand Webinar: How Medical Software Teams Break The Regulatory Bottleneck
Every medical device you ship needs a decade of security updates, maintenance, and regulatory upkeep...
Watch Video