
Easy, Customizable
3D & 2D Graphs

Create interactive, rapidly responding graphs out of your data, from simple plots to complex visualizations. Dynamically customize your graphs from appearance and labels to user interactions and automation.

3D Graphs

3D graph example from Qt highlights


2D Graphs

2D graph example from Qt highlights

Volumetric Rendering

Volumetric rendering example from Qt highlights

Dynamic Graphs from Simple to Complex Needs

Whether you're building dashboards, scientific tools, or industrial UIs, have your graphs needs covered with Qt’s extensive data visualization libraries and high-performance capabilities. Visualize simple datasets quickly or for complex, high-precision cases, flexibly use advanced techniques such as volumetric rendering or 2D slicing from 3D.

Fast & Easy Cross-Platform Graphs

Create graphs right out of the box, customize them to your needs, and deploy them easily for any platform, such as Windows, macOS, or embedded.

See How

High-Performance Graphing

Render large datasets smoothly with graphics acceleration and native rendering for responsive graphs, also for real-time data.

Explore

Stability, Longevity and Reliability

Build your graphs with confidence, utilizing a trusted, well-supported framework with long-term stability and praised documentation.

Learn More

With Qt, structured data visualization in graphs and tables, as well as theme customization, are easily integrated and customizations are completed quickly.

Seonggong Moon, Head of Product Development, Oncosoft

Go to Their Story

CROSS-PLATFORM EFFICIENCY

Use Your Graphs Across All Platforms

Re-use your graphs easily across devices and operating systems, ensuring they look and perform their best on all target platforms and use cases. For example:

  • Windows, macOS, Linux, etc. for desktop
  • Android, iOS, etc. for mobile
  • Embedded systems

Spend less time on routines and gain faster time-to-market for your application.
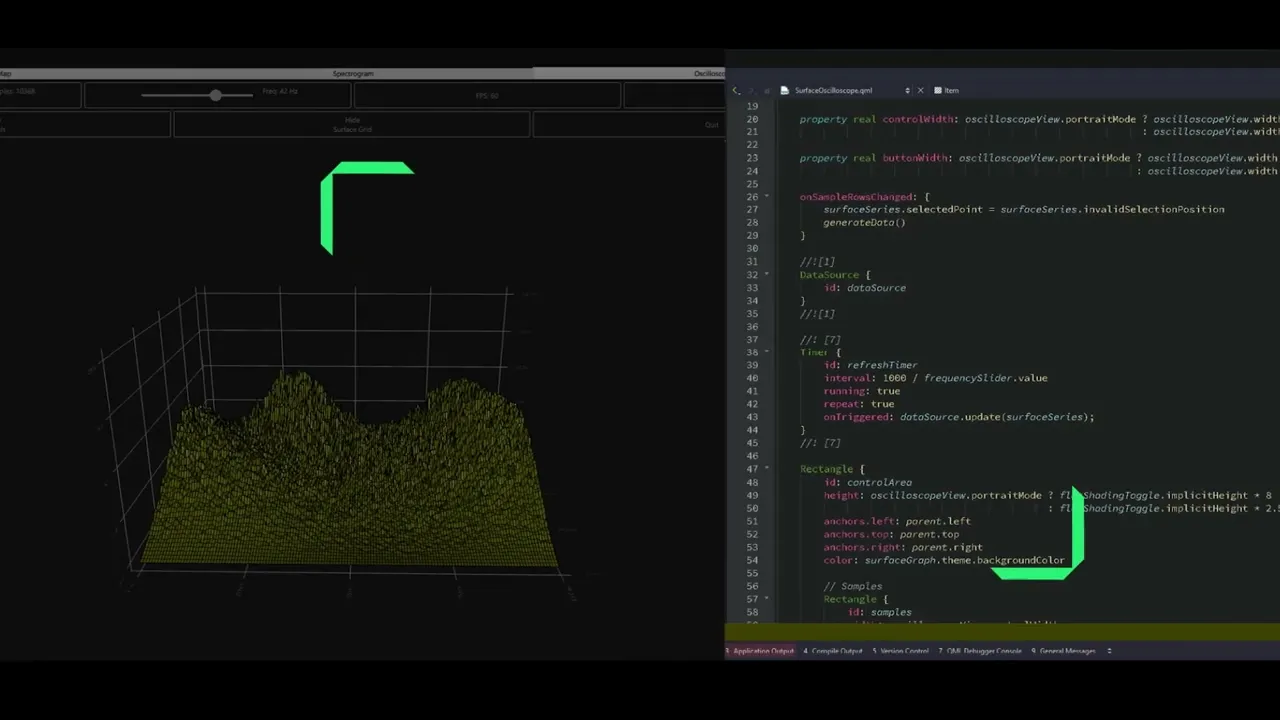
REAL-TIME GRAPHING

Enjoy the Smoothness of Graphics Acceleration

Rest assured your graphs stay responsive and visually sharp, even with large datasets or real-time data streams. Leverage graphics acceleration for:

  • Highly responsive graphs
  • Faster loading times
  • Smoother interactions for your end users
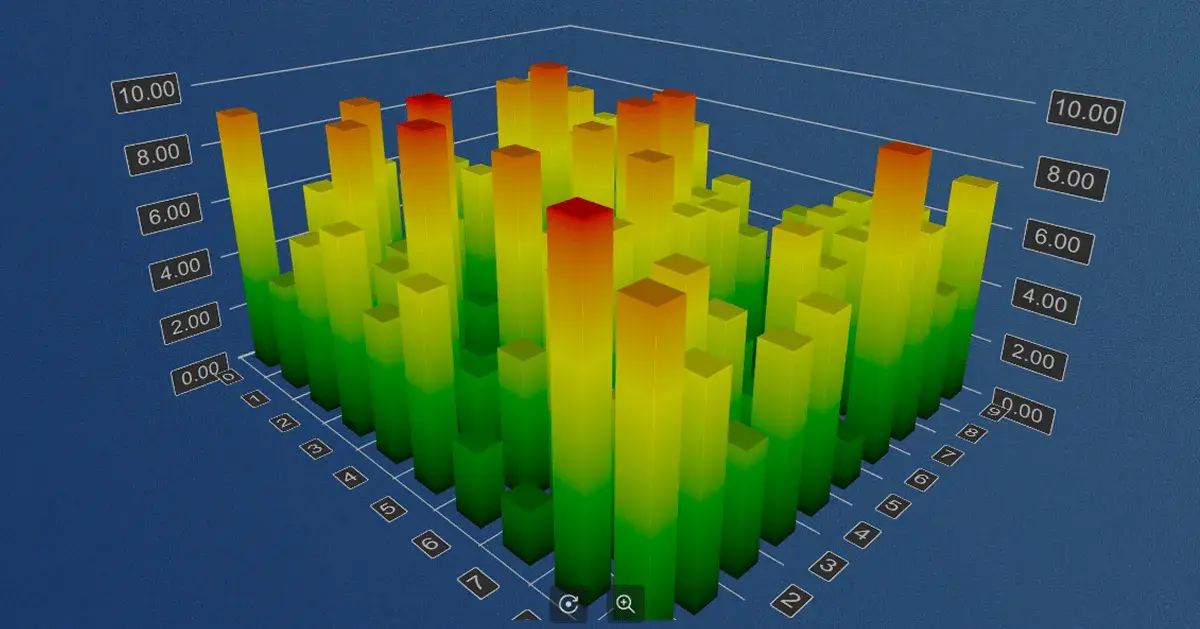
Available 3D Graph Types

3D Bar Graphs

Visualize multiple dimensions of data in series of vertical bars. Use e.g. for cumulative data and more complex comparisons.

3D bar graph example with Qt

3D Scatter Graphs

Visualize trends or groupings of data that you have as single data points. Use e.g. in simulations, such as a car wind tunnel or satellite positions.
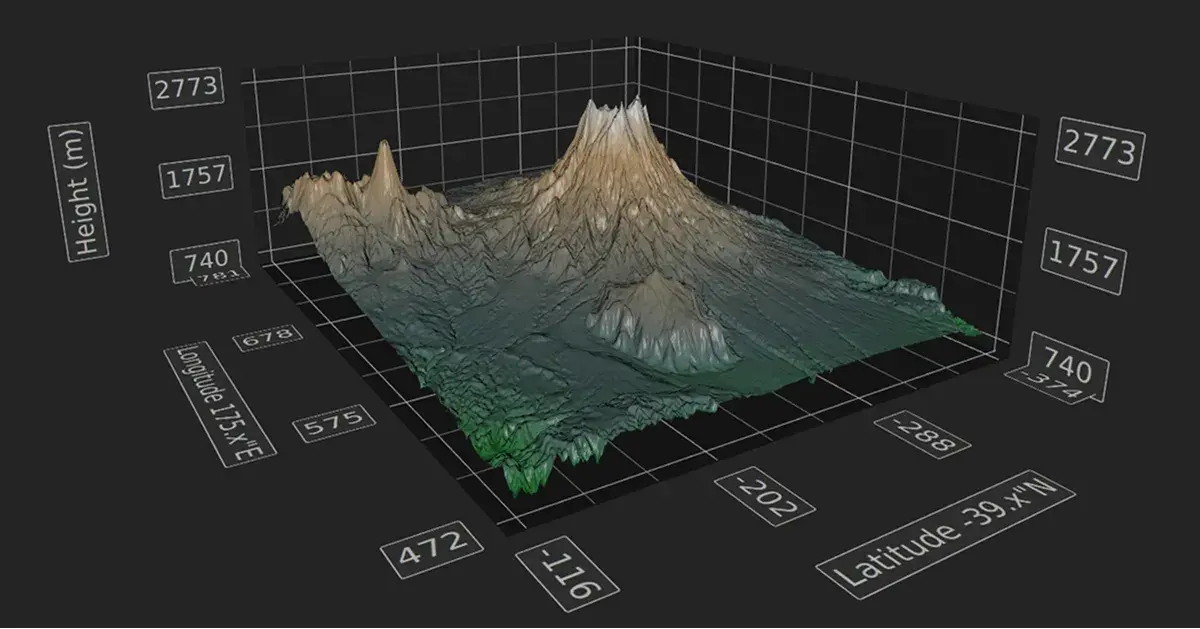
3D scatter graph example with Qt

3D Surface Graphs

Visualize groupings of data that you have as single data points on a plane, to form a surface. Use e.g. for terrain models and triangle meshes.
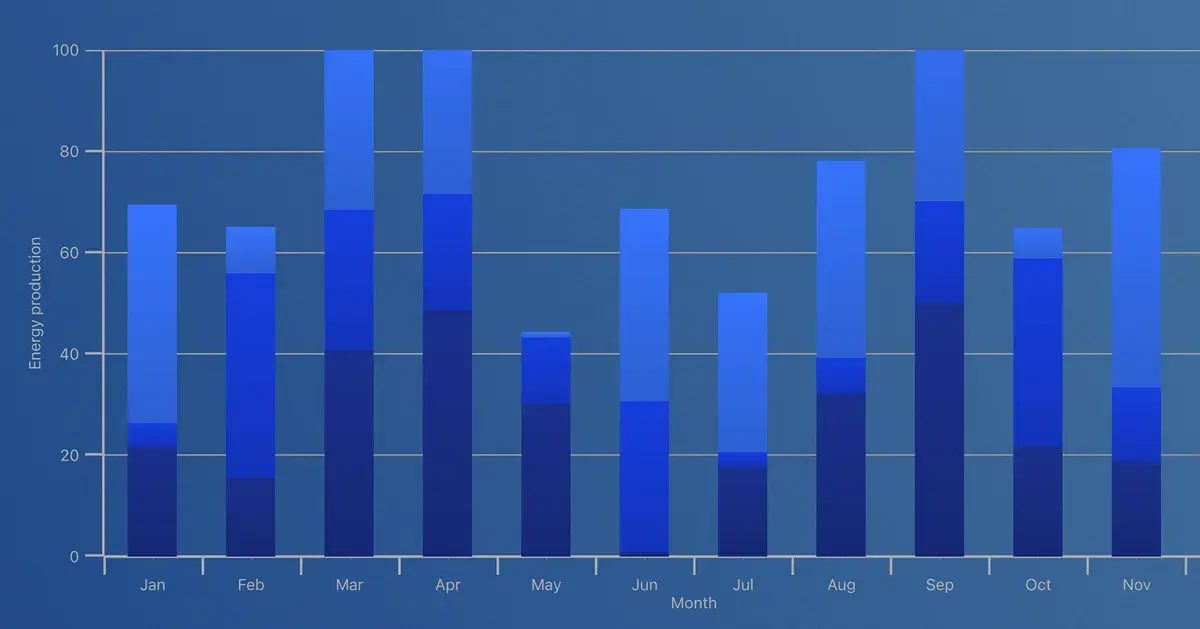
3D surface graph example with Qt
NATIVE RENDERING CAPABILITY

Render for DirectX, Metal, Vulkan, or OpenGL

Enjoy the speed & quality of Qt RHI's native rendering performance, ensuring you always make use of the best rendering option for your target platform.

With native rendering for your 3D graphs, you get:
  • Extremely accurate representation of your graphs
  • Faster rendering and smoother animations
  • Minimized need for separate programming per each platform

Qt allows a lot of data to be displayed in a really beautiful and cool way to ultimately give the trader the kind of comfort and overview that he needs to manage his funds.

Filip Berg-Nielsen, CEO, Volven

Go to Their Story

Available 2D Graph Types

Bar Graphs

Show your data as a series of vertical bars which you can group by category.
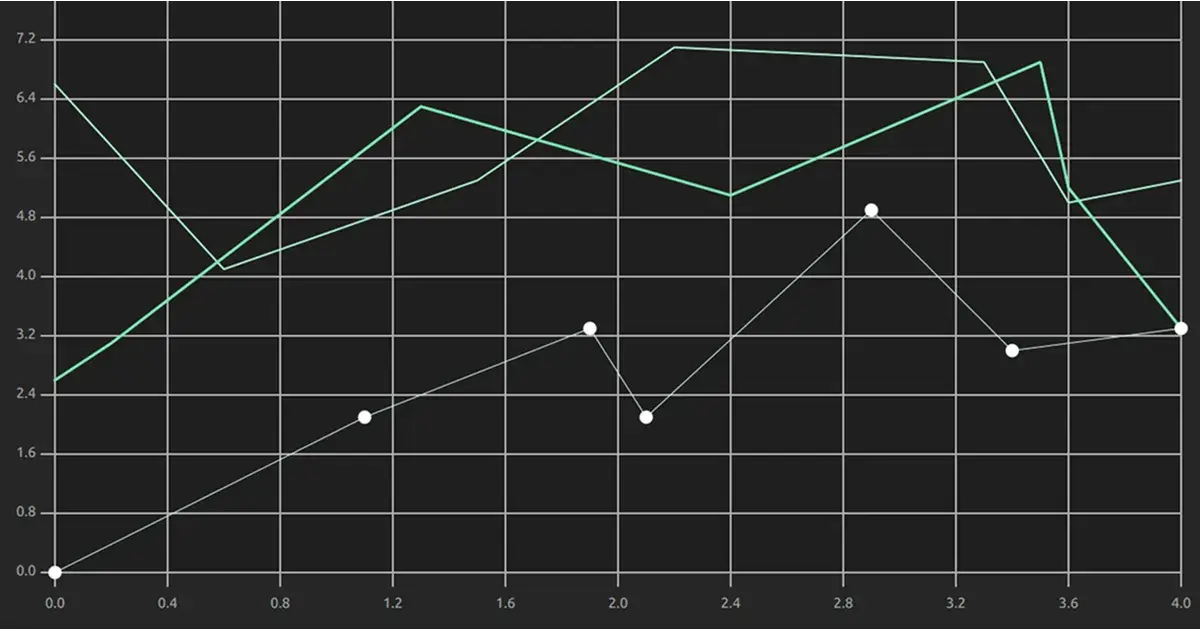
2D bar graph example with Qt

Line Graphs

Visualize a series of data points connected by straight lines.
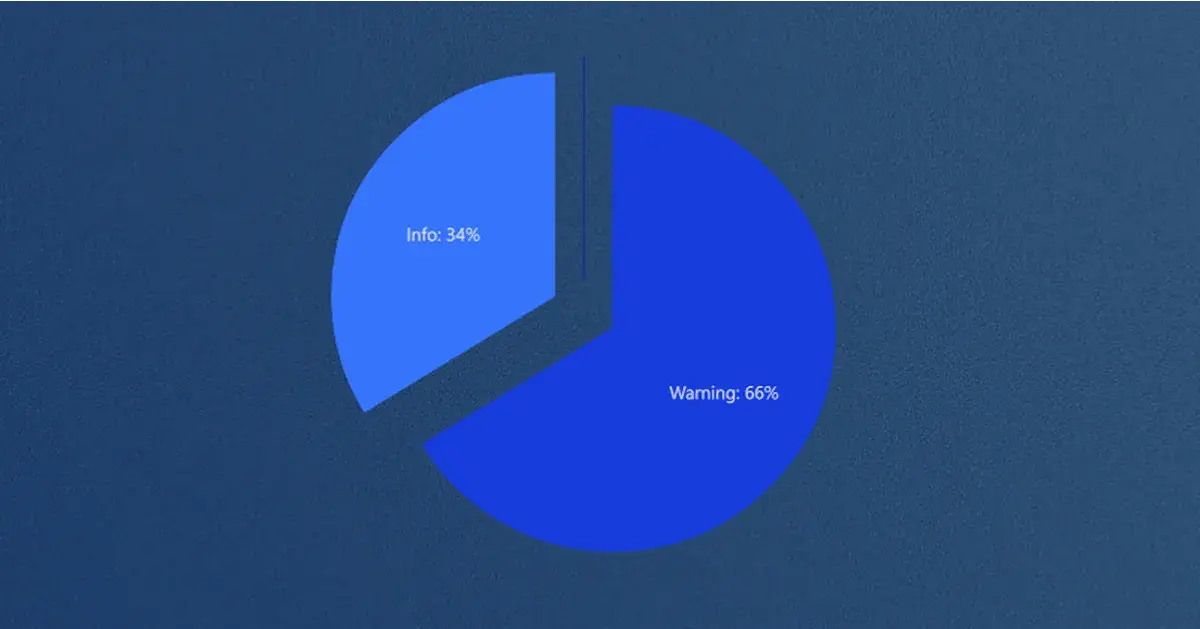
2D line graph example with Qt

Pie Graphs

Show slices as a percentage compared with the sum of all slices.
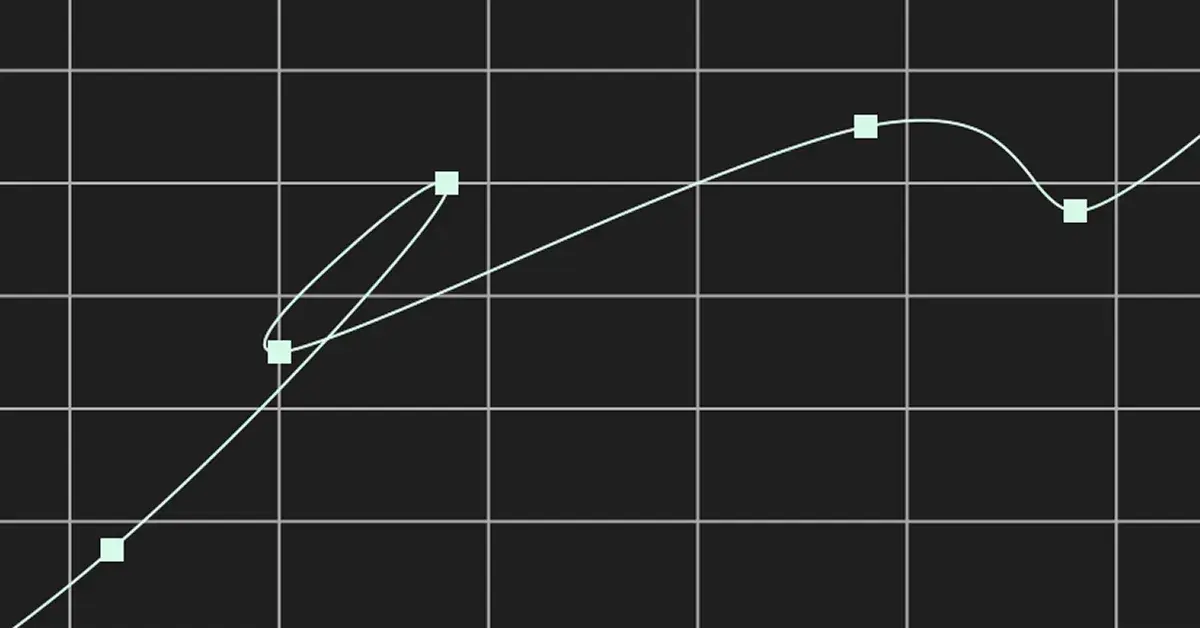
Pie graph example with Qt

Spline Graphs

Connect a series of data points by smooth spline segments that move through all the points.
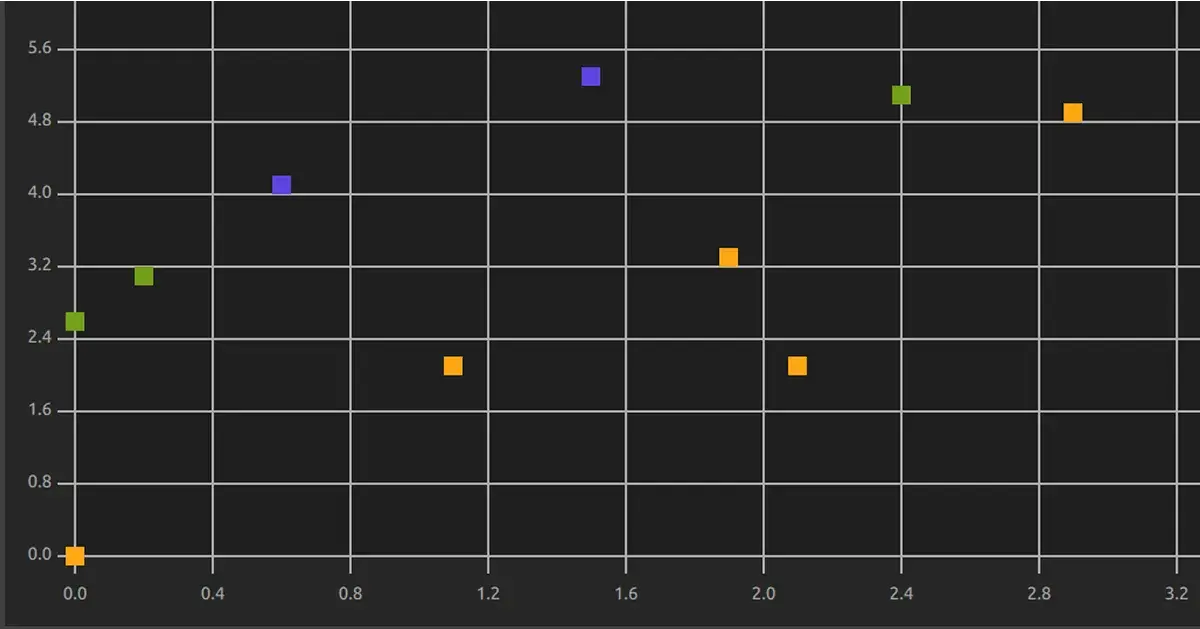
Spline graph example with Qt

Scatter Graphs

Collection of points visualized in an X and Y axis.
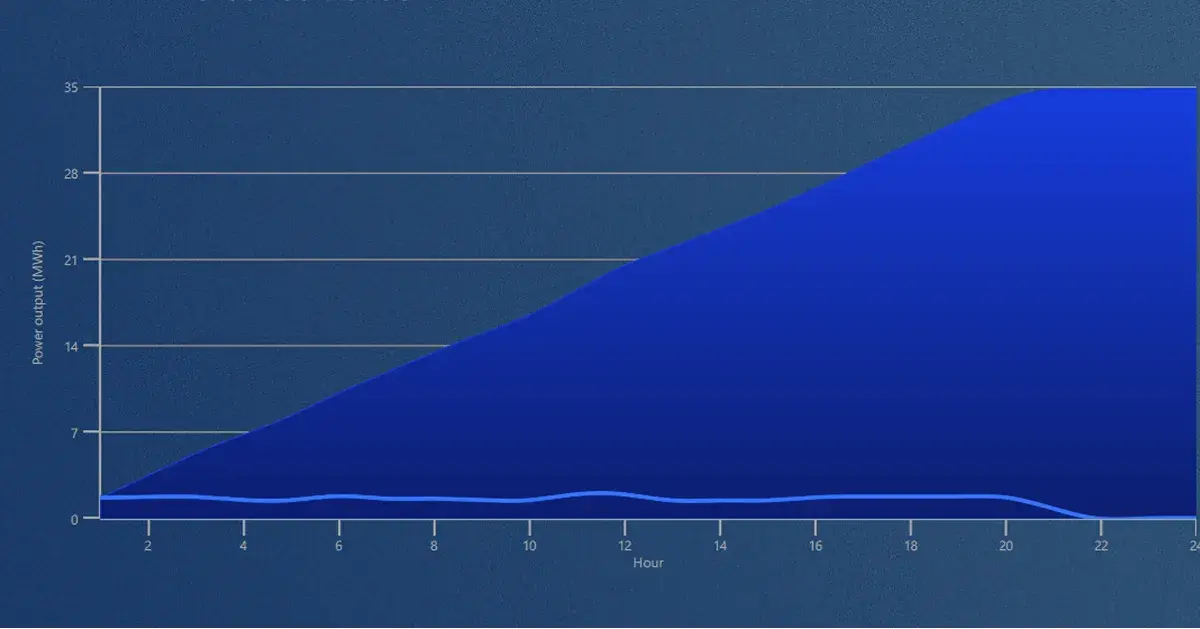
A simple 2D scatter graph example with Qt

Area Graphs

Draw areas composed by corner points. Works also with gradients.
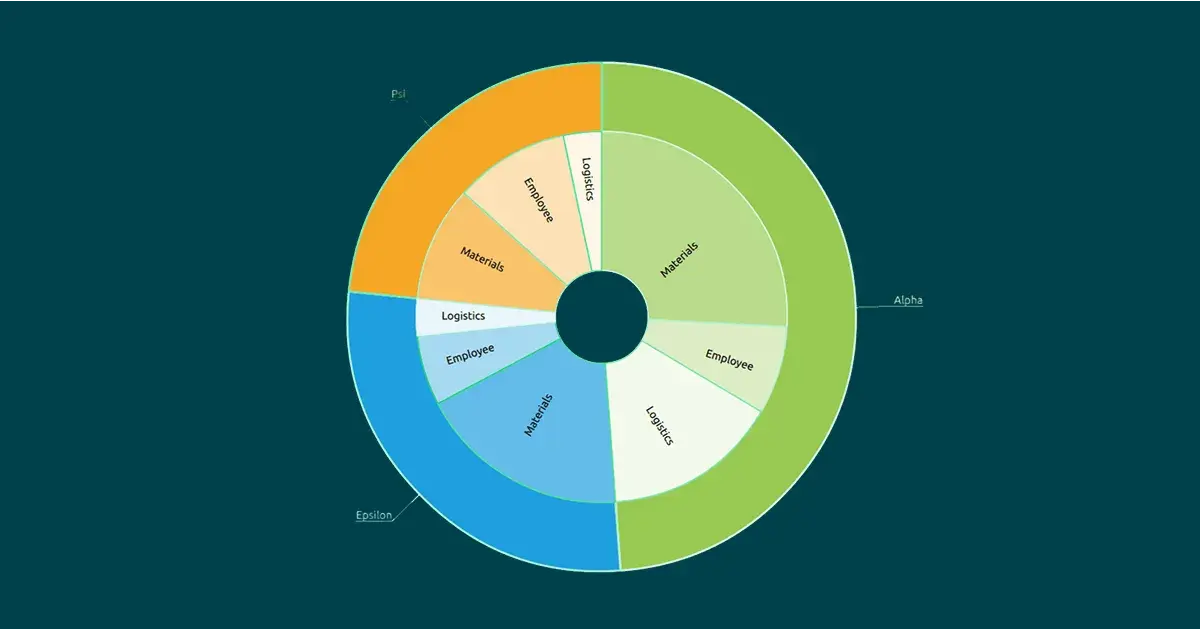
An example of an area graph together with a line graph, built with Qt

Donut Graphs

A special case of a Pie graph, enabling the use of several layers.

2D donut graph example with Qt
Qt 6 logo image
NATIVE RENDERING CAPABILITY

Stability Like Nowhere Else

Build your graphs with the market-proven, well-supported Qt Framework, trusted by over 1,5 million developers worldwide.

With Qt's long-term support, comprehensive documentation, and a strong developer community, ensure your graphs remain stable, maintainable, and future-proof, so you can focus on value-adding, not routines.

More on Graphs

QtGraphs New Features in 6.10

With the release of Qt 6.10 in October 2025, it's time to take a look ...

Read More

What's New In QtGraphs 6.9

QtGraphs recently moved out of tech preview in Qt 6.8 and now, with 6....

Read More

QtGraphs: Qt's Newest Module for Visualizing Data in both 2D and 3D Graphs

This blog post introduces Qt's newest module for visualizing data in b...

Read More

More on Qt Framework

Qt Framework’s comprehensive set of libraries take away your routines from middleware to UI, 2D to 3D, platform to platform.

See What’s New in Graphs

The Qt Graphs module saw some improvements in Qt Framework 6.9. See them explained with examples by our experts in the release webinar.

Take Your Graphs to a Next Level with Qt