
Debugging and Trace

Enhance real-time analysis and fault detection with advanced debugging, multi-core support, and robust system diagnostics.

Smarter Debugging with IAR

blue board and debugging a renesas board.

Early Issue Detection

Quickly identify and resolve software defects in real time using advanced debugging and trace tools. This minimizes costly fixes, enhances system integrity, and ensures long-term reliability while streamlining debugging cycles.

multi core architecture agnostic debug

Multi-Core Debugging

Optimize performance across complex embedded architectures by analyzing interactions between multiple processor cores. This enables better workload distribution and enhances multi-threaded embedded software performance. 

development team

Advanced Trace Capabilities

Gain deep execution insights, allowing engineers to diagnose performance bottlenecks and unpredictable software behavior efficiently. Execution timeline tracking helps pinpoint erratic operations, timing issues, and logic errors.

IAR IDE and VS Code efficiency flexibility female developer

Ensuring Efficient Debugging for Reliable and Optimized Embedded Systems

As software complexity grows, debugging inefficiencies have become a major bottleneck in embedded development. Studies show that developers spend 50% to 90% of their time debugging, equating to 1,000 to 1,600 hours per developer annually. Excessive debugging time delays product releases, stalls innovation, and increases costs—challenges that no development team can afford.

IAR’s debugging and trace solutions empower teams to detect and resolve issues early, enhancing product stability, optimizing performance, and significantly reducing defect rates. By leveraging advanced debugging strategies, development teams can recover lost hours, accelerate time to market, and improve overall software quality.

Reduce Debugging Time, Reclaim Development Resources

By mastering advanced debugging techniques, teams can cut debugging time from 80% to under 5%, reclaiming 1,000+ hours per developer annually. This shift allows engineers to focus on innovation instead of troubleshooting, leading to faster product releases, improved software quality, and lower development costs.

The quality of your product is only as strong as the debugging tools your team relies on. Without deep debugging insights, developers risk applying temporary fixes instead of solving root causes.

Equip your team with IAR’s state-of-the-art debugging solutions and take control of debugging efficiency today.
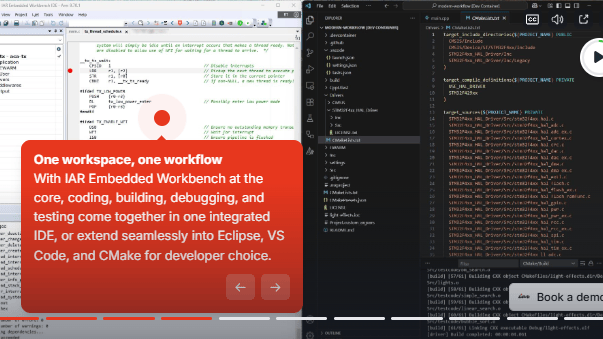
Supademo screen

TRY OUT IAR'S PLATFORM

Interactive Demo

Experience IAR's platform and get an introduction to how it works.

BUILDING BLOCKS

Explore IAR’s Debugging & Trace Components

Enhance embedded software reliability with advanced debugging, real-time analysis, and intelligent trace capabilities for faster issue detection, optimized performance, and long-term stability.

Advanced Debugging Solutions for Faster, More Efficient Embedded Systems

Try Interactive Demo

JTAG, SWD Debugging Support

Perform non-intrusive, real-time debugging to detect faults, optimize system performance, and ensure software integrity.

Execution Timeline Tracking

Gain deeper insights into software execution flow, helping identify timing issues, logic errors, and unpredictable behavior.

Power Visualization & Performance Analysis

Monitor and optimize power consumption and execution efficiency, ensuring resource-constrained systems run optimally.

RTOS-Aware Debugging & Real-Time Insights

Debug real-time operating system interactions, providing visibility into task execution, scheduling, and system responsiveness.

Zephyr RTOS Support

Leverage Zephyr RTOS-aware debugging, multi-core trace, and advanced system diagnostics to accelerate fault detection and enhance real-time analysis.

Gain deep visibility into thread behavior, task timing, and system performance powered by IAR.

Learn More

SEE HOW IT WORKS

What Makes the IAR Platform Smarter for Debugging?

See how the IAR platform delivers advanced debugging and system-level visibility, helping developers find and fix issues faster.

TRANSFORMING CHALLENGES IN TO SUCCESS

Customer Cases

Get inspiration on how world-leading companies enhance their embedded development with our platform.

Casio — Improving Time to Market

Although we increased performance, we also had to maintain power consumption, which is why we divided processing into two cores. It was a lot of work, but we were able to find a balance between improved performance and power efficiency.

Osong Medical Innovation Foundation – Ensuring Medical Software Certification

Quality and certification are critical for the future of high-tech medical devices. By using C-STAT, we can improve code quality while preparing for IEC 62304-certified functional safety upgrades to meet regulatory standards.

NEWGIN – Strengthening Software Quality for the Future

As firmware complexity grows, we see an increasing need for tools that help ensure software quality. Static analysis and CI tool integration will be key to improving reliability and maintaining high standards in development.

VICTEK – High-Quality Code for Secure IoT Systems

Developing low-power IoT systems requires defect-free, high-quality code to ensure secure integration with optimized applications and networks, while minimizing cybersecurity risks.

Landis+Gyr – Early Bug Detection with Static Analysis

To maintain high product quality, we need tools that catch defects early in development. C-STAT allows us to find bugs faster, reduce time to market, and streamline development costs, making it a core tool across our sites.

FAQ

How does real-time debugging with trace capabilities help accelerate issue resolution?

Developers can track software execution in real time, detect issues faster, and avoid time-consuming trial-and-error debugging.

How does investing in better debugging tools translate to faster development cycles?

Faster issue detection and resolution reduce delays, improving overall time-to-market and software quality.

How does multi-core debugging support improve overall embedded system reliability?

It ensures optimized resource allocation and synchronized task execution, leading to stable and efficient applications.

Advanced Debugging Breakpoints in the IAR Embedded Workbench

Learn how to use IAR Embedded Workbench’s advanced breakpoints, including memory-access breakpoints for tracking reads and writes, data breakpoints for monitoring variable changes, and watchpoints for catching incorrect memory behavior. Uncover issues traditional breakpoints miss and gain clearer insight into how your application runs.


Get Access to All

Scale development operations with freedom and flexibility, accelerate innovation with code confidence and simplify compliance while strengthening security.

  • Architecture and device agnostic
  • Cloud-ready, tailored for enterprises
  • Functional safety always included
  • End-to-end embedded security

With our platform, you get access to everything.
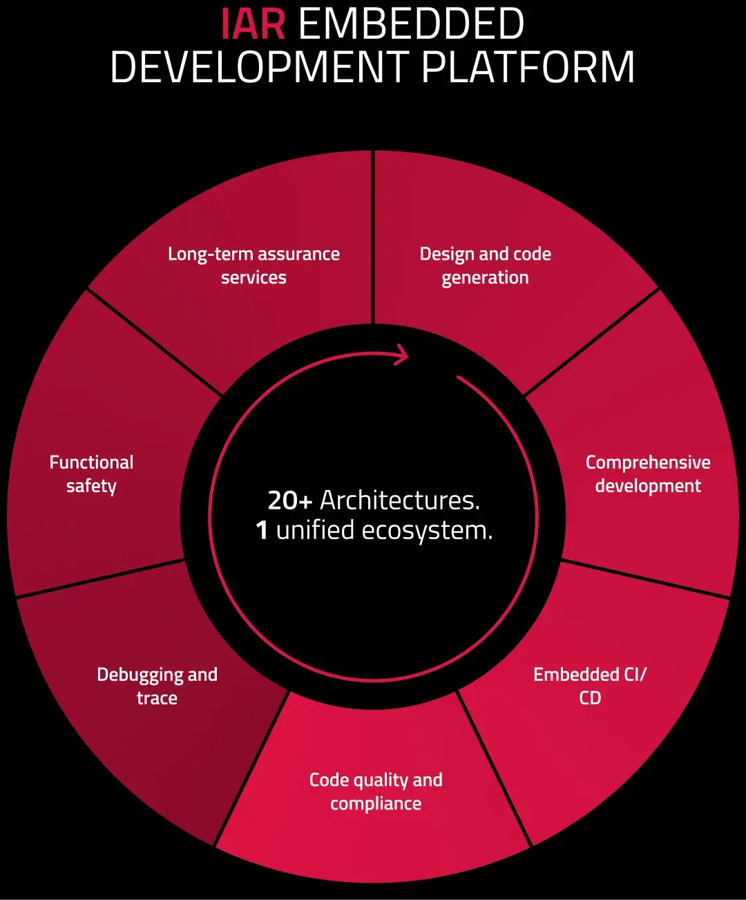

Explore the Platform

Platform wheel without header bigger canvas


Get started today.
Our worldwide sales team is here to guide you.