
Industry Insights Blog Series
Medical technology currently hitting the market is much more complex than it was even just 3 to 5 years ago. We see major changes in how therapies are developed and care is delivered. Themes like Precision health, Real-time insight, via sensors and connected ecosystem, Embedded AI, Continuous data flow, High-performance computing, Data sharing, among others, have become pillars of contemporary Intelligent Health. With such technological complexity in MedTech development, it is an intense effort to ship devices that work effectively. But without usability designed in, even the best-engineered devices may fail their purpose.
What’s the value of a medical or diagnostic device that performs flawlessly—if it isn’t used as intended?
The growing prevalence of chronic diseases, the incorporation of digital technologies in healthcare, the emphasis on value-based care, and technological advancements collectively drive healthcare providers’ integration of remote patient monitoring (RPM).
Source: Gartner, Market Guide for Remote Patient Monitoring Solutions, Robert Potts, 10 February 2025. © Gartner, Inc. and/or its affiliates. All rights reserved.
In this new setting, the users of the medical technology become the most diverse, and to a large extent non-experts. For these reasons, the user experience has to be simple, intuitive, and responsive.
Read more about the importance of UI/UX in MedTech
Pre- and Post-Market Usability Requirements
In the tightly regulated healthcare sector, developers of digital health products, biosensors, and wearables face the challenge of meeting diverse global certifications and approvals. FDA’s primary guidance for usability is the 2016 document, “Applying Human Factors and Usability Engineering (HFE) to Medical Devices,” outlining the process for integrating HFE into device design and validation. Before a regulated Medtech device or application is allowed to be sold into the market, the following must be accomplished (pre-market):
-
Identify Intended Users, Use Environments, and Use Scenarios
-
Conduct Risk Analysis
-
Perform Design and Iterative Testing
-
Perform Summative Usability Testing (Validation)
-
Submit a Human Factors Engineering Report
Once a regulated medical product is on the market, the US and EU require post-market surveillance. Post-Market Surveillance (PMS) is a systematic process of monitoring and collecting data on the safety, performance, and effectiveness of a medical device after it has been placed on the market or put into use. PMS is required for as long as a medical device remains on the market in both the United States and the European Union and should drive continuous improvement to ensure that devices remain safe, effective, and compliant with regulatory requirements throughout their lifecycle.
The European Union (EU) premarket and post-market usability requirements for medical devices are governed by the Medical Device Regulation (MDR) (EU) 2017/745, which emphasizes usability engineering and human factors engineering (HFE). The usability engineering and HFE are specifically called out in the General Safety and Performance Requirements (GSPR) 5 and 22. The Medical Device Coordination Group (MDCG) provides additional guidance, on clinical evaluation, which may include usability data. The EU recognizes the same international standards as the US, IEC 62366-1:2015: and ISO 14971:2019. Once a regulated medical product is on the market, the US and EU require post-market surveillance. Post-Market Surveillance (PMS) is a systematic process of monitoring and collecting data on the safety, performance, and effectiveness of a medical device after it has been placed on the market or put into use. PMS is required for as long as a medical device remains on the market in both the United States (US) and the European Union (EU). The FDA, under the Code of Federal Regulations (CFR), 21 CFR Part 822 (Postmarket Surveillance) and 21 CFR Part 820 (Quality System Regulation), requires Post Market Surveillance for certain Class II and Class III devices that meet specific criteria. The EU, under Medical Device Regulation (MDR) 2017/745, requires Post Market Surveillance for all classes of medical devices placed on the EU market, with requirements proportional to the device’s risk class. In addition to the pre-market and post-market requirements discussed, continuous improvement is a critical aspect of medical device regulation in both the United States (FDA) and the European Union (EU), as it ensures that devices remain safe, effective, and compliant with regulatory requirements throughout their lifecycle. For the US FDA, continuous improvement is primarily governed by the Quality System Regulation (QSR) under 21 CFR Part 820. For the EU, The Medical Device Regulation (MDR) 2017/745 embeds continuous improvement in the. Quality Management System (QMS) (Article 10, Annex IX), Post-Market Surveillance (PMS) (Articles 83–86), Post-Market Clinical Follow-Up (PMCF) (Annex XIV, Part B), Vigilance (Articles 87–92), and Technical Documentation Updates (Annex II and III).
Pre- and Post-Market Usability Studies: Methods and Best Practices
With such stringent international requirements for pre- and post-market usage monitoring, the question is “What methods and best practices should be followed when collecting usability data?”
For the FDA HFE Guidance, EU MDR, IEC 62366 and ISO 14971, the recommended and standard data collection methods are cognitive walk-through, observation, discussion, and interview. However, these traditional methods for data collection are not as reliable and accurate as obtaining real-time usage metrics from the device itself. Even in very controlled environments, like in pre-market studies, users can be distracted, unaware, mistaken, not fully tracking their actions and activity (acting on “muscle memory”), or lose focus. In real-life situations, these setbacks and difficulties increase exponentially when personnel are interviewed regarding the use of a device during a hectic 12-hour hospital shift.
Supplementing traditional methods with real-time usage data provides more accurate usage information. However, obtaining such real-time device usage data has typically been the biggest challenge in both pre-market usability studies and post-market surveillance.
As per the Veeva Medtech article, TOSOH: Defining a Postmarket Surveillance Strategy to Drive Risk-Based Decisions
Collecting accurate, high-quality data remains a major PMS challenge. Traditional methods can fall short, producing inconsistent data that delays complaint investigations and hinders effective vigilance assessments. Manufacturers should focus on capturing more relevant and complete information to improve outcomes and enable better informed risk assessments.
Providing accurate, real-time usage data is exactly what Qt Insight Tracker does and in the next sections we'll see what type of data and how to integrate PMS into medical devices.
Turning Usage Data into Insight
Qt Insight Tracker uses an event-based model: clicks, screen navigations, workflow transitions and even custom application data can all be captured as events. But capturing is just the first step. The real value comes when routing these events through a data pipeline and making them visible to engineers, product managers, and compliance teams. By embedding device tracking directly into usage analytics:
-
Compliance teams gain continuous evidence that maintenance guidelines are being followed
-
Post-market surveillance reports can include real-world statistics on how devices are operated and serviced
-
Regulatory submissions can be backed by objective usage data, rather than assumptions or sparse reports
This approach transforms medical device tracking from a manual process into a continuous, data-driven compliance asset, helping manufacturers stay ahead of both maintenance issues and regulatory requirements.

From Events to Insights: Building the Pipeline
One straightforward way to achieve this is by deploying a Snowplow data pipeline to the cloud (AWS, GCP or Azure). With Terraform, one can set this up in a few hours. At a high level, here’s what gets deployed in AWS with the quickstart module:
-
Collector: receives events from Qt Insight Tracker over HTTPS
-
Iglu schema registry: ensures events follow your defined schema
-
Enrichment: validates and processes events (adding context, optional geo info, etc.)
-
Storage: PostgreSQL database (via RDS) or optionally a data lake in S3
-
Visualization: AWS QuickSight dashboards for analysis

Image 1. Sample Analytics Pipeline with Snowplow and Amazon Services
To spin up this pipeline, you’ll need a few basics:
-
Terraform and AWS CLI installed
-
An AWS account with VPC/subnet access
-
A domain + SSL certificate for secure event collection (Insight Tracker requires HTTPS)
Steps at a glance:
-
Deploy the Snowplow quickstart with Terraform.
-
Configure your collector endpoint with HTTPS.
-
Upload the Qt Insight Tracker schemas to the Iglu server using igluctl.
-
Point your Qt Insight Tracker-enabled app to the collector endpoint.
-
Explore the data in QuickSight - build dashboards to track workflows, error patterns and user behaviors.
Once this pipeline is in place, the data loop is complete:
-
Engineers see where users struggle in real workflows
-
Product managers get data-driven prioritization for improvements
-
Compliance teams gain stronger evidence for FDA/EU post-market surveillance
-
End-users ultimately get devices that are safer, easier to use, and more effective
With Qt Insight Tracker and a cloud data pipeline, real-world usability isn’t guesswork anymore; it’s measurable, visible, and actionable.
Visualizing Workflows with Diagrams
One powerful way to explore device usage is by visualizing state transitions in a Sankey diagram. In the example below, one can see how an infusion pump moves through different states—standby → configure → running → completed → standby.
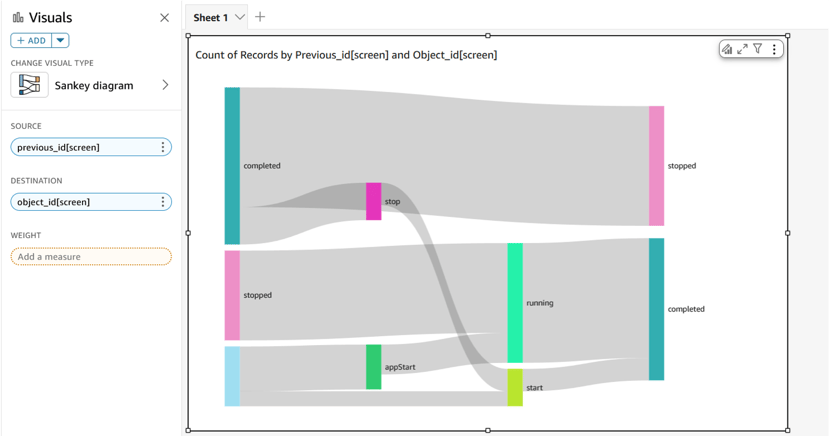
The thickness of each flow represents how often users follow that path, making it easy to spot the most common workflows as well as less frequent, unexpected ones. Such diagrams can reveal:
-
Whether users are following the intended workflow or skipping steps.
-
If there are bottlenecks (e.g., devices stuck in “configure”).
-
Patterns of premature termination (e.g., powerOff before “completed”).
This turns raw event data into actionable insight—engineers and PMs can instantly see where to focus improvements.
Tracking Consumables and Maintenance with Custom Data
Not all insights are about clicks and workflows. With Qt Insight Tracker, one can also capture custom application data that ties directly to device usage and maintenance. For example, in an infusion pump, one might want to know how many times a pump has been run before the consumables (like tubing or fluid) need replacement. By pushing a simple JSON payload with each run, the pipeline can parse this field and show it in QuickSight.

The table shows a run count per session, revealing how many times a particular device was operated. With this data in place, you can:
-
Detect when a device is approaching its maintenance threshold
-
Alert service teams proactively before consumables fail
-
Track usage patterns per device to optimize replacement cycles
-
Provide compliance evidence that consumables are maintained according to manufacturer or regulatory guidelines
If you need real-time usage analytics to enhance your medical products constantly or to achieve regulatory compliance more easily, contact us.


Traditional methods for data collection are not as reliable and accurate as obtaining real-time usage metrics directly from the device.