
IAR C-SPY Debugger

Part of IAR Platform

IAR C-SPY shows you what your system is doing, and when. Use breakpoints and stepping to inspect your code, and use trace and the timeline to catch the bugs that disappear when the CPU stops. 

Key Benefits

C-SPY gives you control over your code and visibility into the running system, in one debugger.

  • See the System
  • RTOS-Aware Debugging
  • Debug Without Stopping the Target
  • One Debugger on Linux and Windows
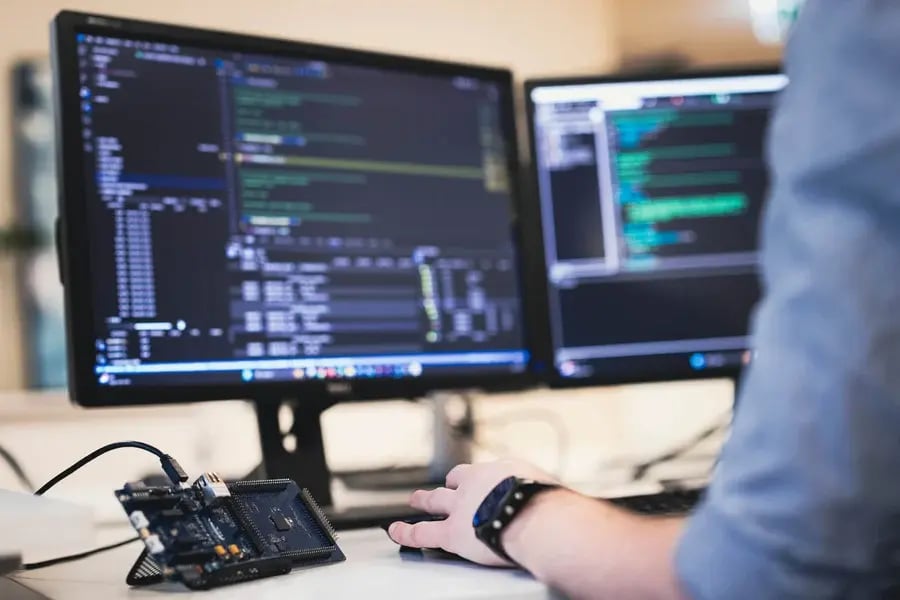
female developer degugging code

See the System, Not Only the Code

A breakpoint stops the CPU, but peripherals, DMA, and interrupts keep going, so timing bugs often vanish the moment you look. C-SPY records interrupts, RTOS task switches, software events, data logs, and, with a suitable probe, power measurements on one timeline while the application runs at full speed.

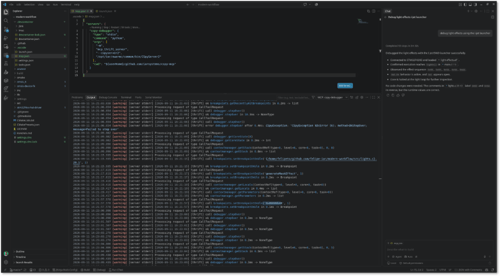
debugging  on vs code with iar debugger

RTOS-Aware Debugging

Raw memory does not tell you why a task is waiting. With RTOS awareness, C-SPY shows tasks, queues, semaphores, and mailboxes, and supports task-specific breakpoints and stepping. Thread state, priority, and stack usage sit next to the trace, so you can see when a task was ready but never running.

development team meeting reviewing code

Debug Without Stopping the Target

Attach to an application that is already running, without a reset or a download, and record what happens next. A rig that fails every few hours keeps its state. Attaching depends on the driver and device, and C-SPY tells you when it is not supported.

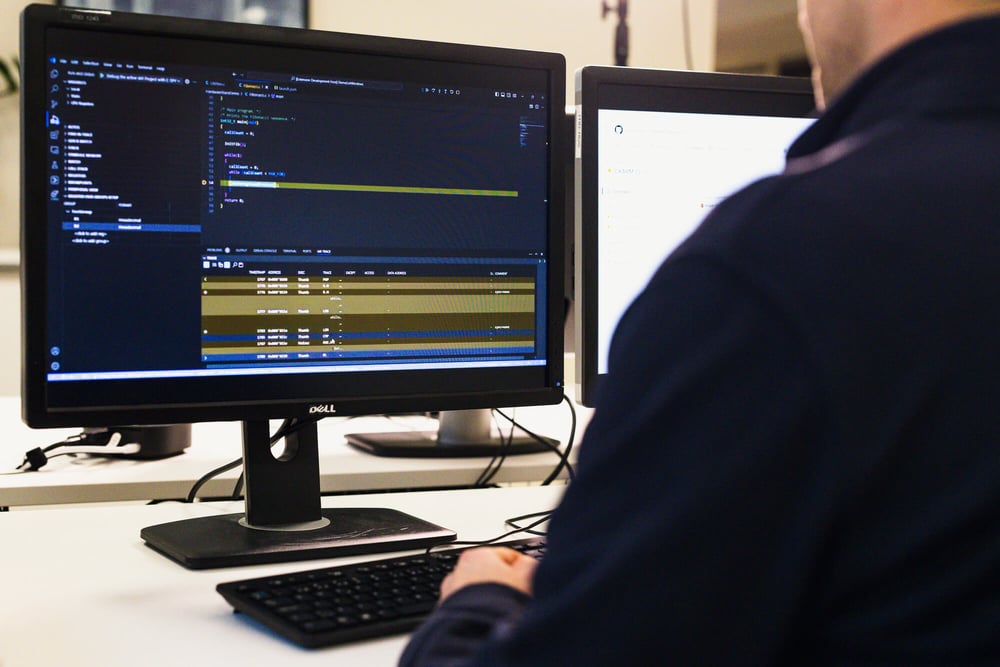
IAR IDE and VS Code efficiency flexibility female developer

One Debugger on Linux and Windows

The IAR cross-platform IDE brings the same C-SPY experience to Linux and Windows: RTOS awareness, timeline analysis, profiling, power monitoring, and trace. Teams can use one debugging workflow on workstations, in containers, and in the lab, without a Windows virtual machine kept around for the debugger.

Features

C-SPY combines everyday source-level debugging with trace, profiling, and automation, inside the IDE and from the command line.

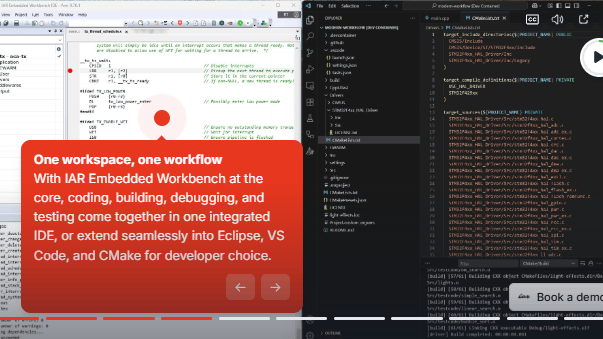
Integrated in IAR Embedded Workbench

C-SPY is part of the IDE, so you edit, build, and debug in one place. Fix code in the window you are debugging in, set breakpoints at any point in the development cycle, and keep watch properties, window layouts, and register groups between sessions. Switch between C, C++, and assembler source and disassembly as needed.

Command-Line and CI Support

Run C-SPY from the command line with cspybat for batch runs, including attach to a running target. With IAR Build Tools available as container images, the same environment runs on a developer desktop and in automated test pipelines on Linux and Windows.

Stepping and Breakpoints

Every statement and function call is a step point, including calls inside expressions and parameter lists, which helps when you debug C++ constructors. Code and data breakpoints show whether your logic is right and how and when data changes. Macros automate complex sets of actions.

Variable and Memory Inspection

Monitor variables and expressions continuously or on demand. View STL lists and vectors as containers, inspect CPU and peripheral registers and memory in configurable windows, and use the graphical stack view to catch overflow. The call stack is available without a runtime penalty.

Trace, Profiling, and Coverage

Use Embedded Trace Macrocell (ETM) instruction trace on devices that have it, Serial Wire Output (SWO) trace on most Cortex-M3 and higher devices, and the Micro Trace Buffer (MTB) on many Cortex-M0+ devices. Count events and CPU cycles through the Performance Monitoring Unit (PMU). Code coverage is available where the core or device supports it.

AI-Assisted Debugging

An open-source Model Context Protocol (MCP) connector gives AI assistants access to C-SPY debugger and trace data, so they can analyze what happened on the target, not only what the source says. The target keeps running where possible, and the developer approves the fix.

Supademo screen

TRY OUT IAR'S PLATFORM

Interactive Demo

Experience IAR's platform and see trace, RTOS awareness, and timeline analysis working together. 

Supported Architectures

  Arm RISC-V Renesas RL78 Renesas RH850 Renesas RX AVR AVR32 MSP430 8051 STM8 Renesas V850 CR16C
C-SPY Debugger checked checked checked checked checked checked checked checked checked checked checked checked

Supported Devices in C-SPY

Architecture Manufacturer Family Device
Loading...
blue board and debugging a renesas board. (1)

Supported Debug Probes 

C-SPY connects to your target through a driver, so you can debug with the probe you already have or with IAR’s own. 

IAR Debug Probes

I-jet debugs Arm and RISC-V devices. On Arm Cortex-M it also provides SWO trace, and I-jet Trace adds ETM instruction trace, so you can step backward from a fault.  Explore IAR Debug Probes.

Additional Supported Debug Probes and Drivers

  • Simulator (All)
  • CMSIS-DAP probes (Arm)
  • J-Link and J-Trace (Arm), J-Link (others)
  • ST-LINK JTAG/SWD (Arm, ST Cortex-M devices only)
  • TI XDS100v2, XDS100v3, XDS110, and XDS200 (Arm)
  • Renesas E2 and E2 Lite (Arm Cortex-M devices and others)
  • Renesas E1 and E20 emulators (others)
  • GDB Server (Arm and others)

FAQ

Why Do Embedded Timing Bugs Disappear When You Set a Breakpoint?

A breakpoint stops the CPU, but peripherals, DMA transfers, and external signals keep running. Interrupts queue up and fire in a different order when execution resumes, so the timing window that caused the failure never opens. A timeline recorded while the application runs at full speed avoids that.

Can the IAR C-SPY Debugger Attach to a Running Application Without a Reset?

Yes. Use Attach to Running Target to connect without a reset or a download. Breakpoints defined in the project are set during attachment, or disabled if they cannot be set without stopping the target. Not every driver and device combination supports it, and C-SPY tells you when it does not.

Do I Need a Trace Probe for SWO and ETM Trace Debugging?

Not for most timing problems. SWO-based trace works with a standard debug probe on most Cortex-M3 and higher devices. ETM instruction trace needs a device with an ETM and a trace-capable probe such as I-jet Trace. Many Cortex-M0+ devices offer simple instruction trace through the MTB, which stores data in a circular buffer in on-chip RAM, so capture depth depends on the RAM you allocate.

Does the IAR C-SPY Debugger Run Natively on Linux?

Yes. The IAR cross-platform IDE offers the same C-SPY experience on Linux and Windows, including RTOS awareness, timeline analysis, profiling, power monitoring, and trace.

Which RTOSes Does the IAR C-SPY Debugger Support With RTOS Awareness?

RTOS awareness comes from plugin modules provided by IAR and third-party suppliers. Examples include Eclipse ThreadX, FreeRTOS, SafeRTOS, PX5 RTOS, SEGGER embOS, and SCIOPTA. Support varies by architecture and release. Contact the third-party suppliers for more details.

Can I Run the IAR C-SPY Debugger in a CI Pipeline?

Yes. cspybat runs C-SPY from the command line for batch runs. With IAR Build Tools available as container images, you can use the same environment on a developer desktop and in automated pipelines on Linux and Windows.

Can AI Assistants Connect to the IAR C-SPY Debugger Through MCP?

An open-source MCP connector gives AI assistants access to debugger and trace data. For timing bugs, keep the target running whenever possible, because an assistant that repeatedly halts the CPU can hide the bug just like a breakpoint. The developer remains responsible for interpreting the results and approving the fix.

IAR Software Insights

How to Use AI Agents for Embedded Development with IAR Tools

Give Your AI Agent the Same Tools You Trust on Your Embedded Project A...
Read More

Highlights from Microelectronics UK in Embedded Software Development

"Do You Really Expect Developers to Write Code?" It was not the questi...
Read More

From Edge AI to 10-Year Product Lifecycles: Key Takeaways from embedded world North America 2026

AI dominated embedded world North America 2026. Every major silicon ve...

Read More

Get Access to All

Scale development operations with freedom and flexibility, accelerate innovation with code confidence and simplify compliance.

  • Architecture and device agnostic
  • Cloud-ready, tailored for enterprises
  • Functional safety always included
  • Native on Linux and Windows

With our platform, you get access to everything.

Explore the Platform

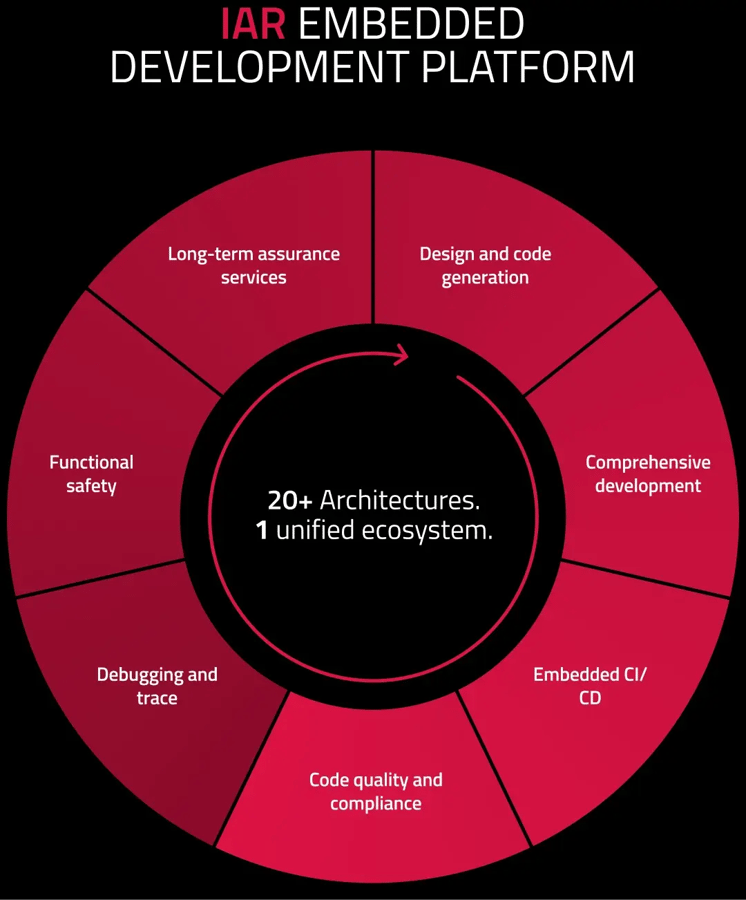
Platform wheel without header bigger canvas


Get started today.
Our worldwide sales team is here to guide you.