Published On
Oct 1, 2026
Read Time
6 mins
Every embedded engineer knows the feeling.
A customer reports a failure that never appeared during development. Maybe a communication stack times out unexpectedly. Maybe a motor controller becomes unstable under a specific load profile. Eventually the team reproduces the problem in the lab, attaches a debugger, and starts stepping through the suspected code path.
And then the bug disappears.
Everything looks correct. Variables hold the expected values. Execution follows the intended path. Yet hours after the debugger is disconnected, the failure quietly returns.
Nothing changed in the source code. Nothing changed in the hardware. The only thing that changed was timing.
Many embedded failures don't come from incorrect code at all. They come from the interaction between tasks, interrupts, drivers, and middleware running concurrently: race conditions, interrupt latency, scheduling order, and timing windows measured in microseconds. Engineers have a name for this kind of problem: the heisenbug.
For teams increasingly developing on Linux, containers, and CI/CD platforms, these debugging challenges become even more difficult when advanced visibility tools require a separate operating system or debugging environment.
Why Do Some Embedded Bugs Disappear Under a Debugger?
A breakpoint stops the CPU, but it doesn't stop the world around it. Peripherals, DMA transfers, and external signals may keep running while the core is halted. Interrupts queue up and fire in a different order when execution resumes. Even stepping through code stretches a few microseconds into seconds.
For a timing-dependent bug, that's enough to make the problem vanish. The race window that caused the failure never opens, because the act of observing the system has changed its timing. Debug builds with lower optimization can shift timing further still.
The result is a frustrating loop: the bug appears when nobody is watching and disappears the moment anyone looks.
What Does a Timeline Show That a Breakpoint Can't?
A breakpoint is an excellent tool for understanding code. It is often a poor tool for understanding a system in motion.
In a system built from RTOS tasks, interrupt handlers, drivers, and middleware all competing for shared resources, engineers are rarely hunting for a single wrong line. They're trying to understand what happened in the milliseconds before the failure. A breakpoint gives a frozen snapshot. Complex failures need a timeline.
Real-time visibility tools provide that timeline by recording system activity while the application keeps running at full speed. With IAR C-SPY, engineers can:
- See RTOS task scheduling and context switches as they happen, to spot tasks that run late, block unexpectedly, or starve each other
- Measure interrupt activity and latency, to find handlers that run too long or fire at the wrong moment
- Profile execution time, to see where the CPU actually spends its cycles under real load
RTOS awareness shows the system in terms of tasks, queues, and semaphores rather than raw memory.
It's worth being clear about what each technology needs and how much it affects the system:
- ETM instruction trace records execution without touching the application at all. It needs a device with an ETM, available on many Cortex-M3 and higher devices, and a trace-capable probe such as I-jet Trace.
- SWO-based trace and sampling work with a standard debug probe on most Cortex-M3 and higher devices. Hardware sampling is close to non-intrusive; software instrumentation adds a small, predictable overhead.
- Cortex-M0 and M0+ devices don't have an ETM or SWO, so options there are more limited.
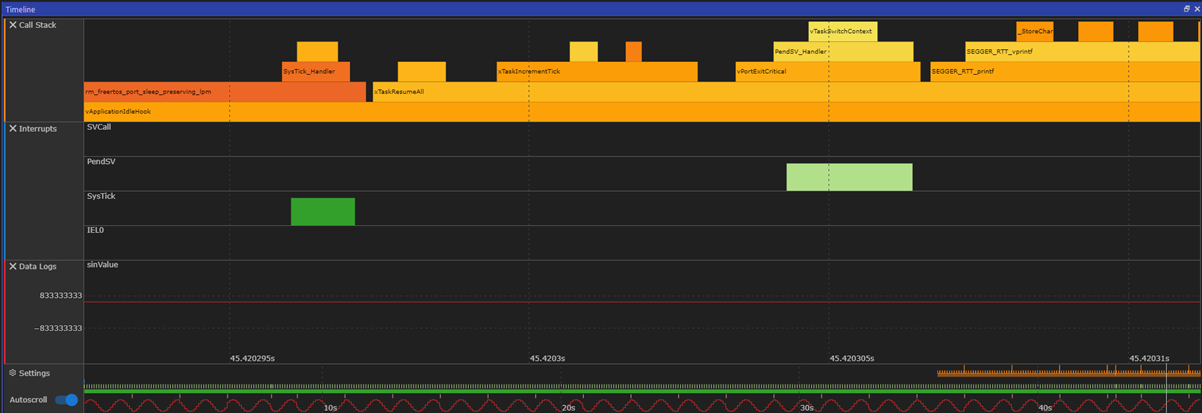
Figure 1. Combined ETM and SWO trace visualization correlating function execution, interrupt activity, and runtime events on a common timeline for detailed timing and execution analysis.
Arm's CoreSight documentation covers the underlying mechanisms in more detail.
How Does Trace Find a Timing Bug? Back to the Motor Controller
Take the unstable motor controller from the opening. With the system running at full speed under the problematic load profile, the timeline makes the pattern immediately visible. Instead of relying on snapshots taken at a breakpoint, engineers can observe interrupts, trace events, and application behavior over time, making timing-related failures far easier to diagnose.
The high-priority control task needs a shared buffer held briefly by the low-priority communication task. Normally the buffer is released in microseconds. Under peak load, a medium-priority diagnostics task preempts the communication task while it still holds the buffer. The control task waits, misses its deadline, and the control loop becomes unstable. It's a classic priority inversion, and it only happens when all three tasks line up under exactly the right load.
The timeline provides a system-level view of execution, revealing interactions between software and hardware that are difficult to reconstruct from source code alone. Whether the investigation happens on a Linux workstation, a Windows desktop, or a lab machine connected through a trace probe, engineers need access to the same debugging capabilities and visibility.
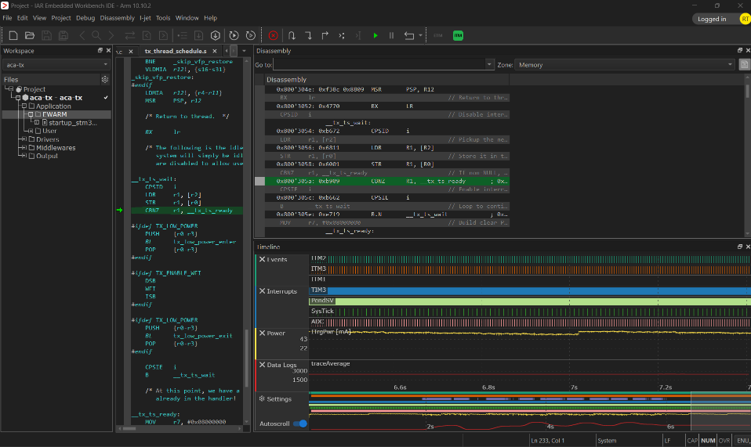
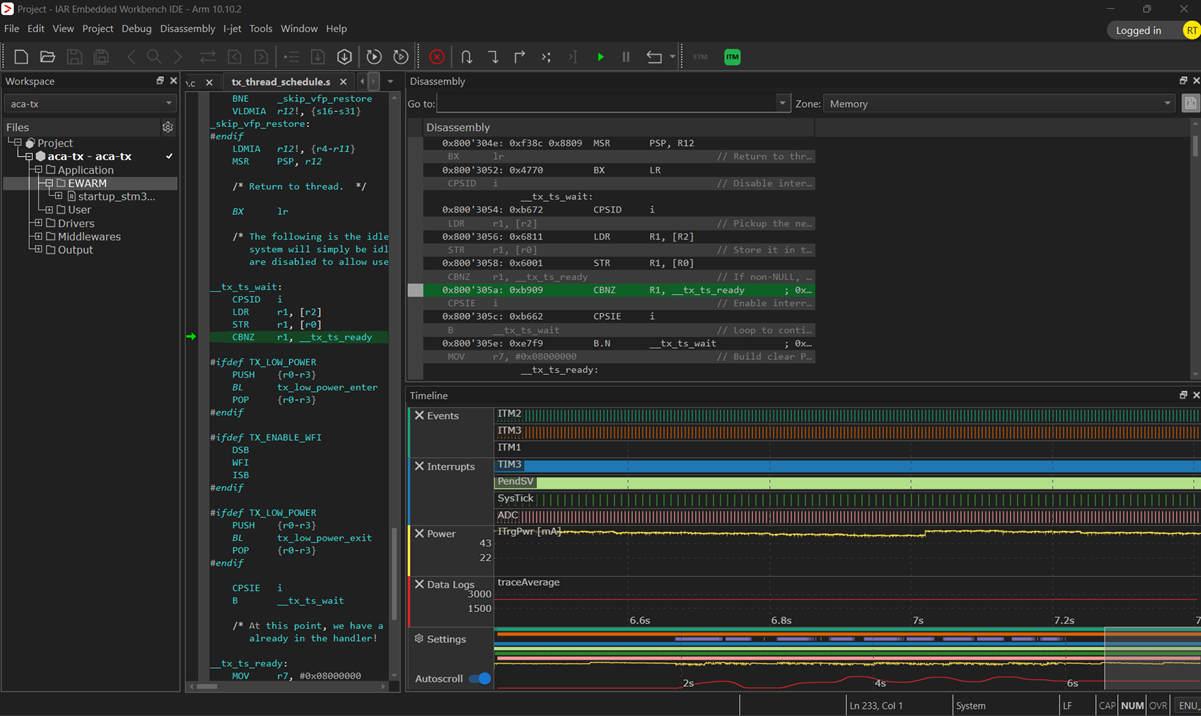 Figure 2. C-SPY timeline analysis in the IAR cross-platform IDE provides a real-time view of system activity, combining interrupt behavior, trace events, data logs, and power measurements in a single timeline. By observing the system as it runs, engineers can identify timing-related issues that may disappear when execution is halted with breakpoints.
No breakpoint would ever have shown this. Halting the system to inspect it removes the very timing that causes the problem. Once the timeline makes it visible, the fix is straightforward: a mutex with priority inheritance. Verifying the fix takes a second trace capture under the same load.
Can You Do Deep Embedded Debugging Natively on Linux?
For many teams, Linux is already the foundation for development, containers, and CI/CD. Advanced debugging, however, has often been tied to a separate Windows machine or a virtual machine kept around just for the debugger.
The IAR cross-platform IDE brings advanced embedded debugging workflows to Linux without requiring a separate Windows environment. Engineers can use the same C-SPY debugging experience, RTOS awareness, timeline analysis, profiling, power monitoring, and trace capabilities on both Linux and Windows. This makes it easier to standardize debugging workflows across developer workstations, containers, lab environments, and CI/CD infrastructure, without maintaining separate toolchains or operating-system-specific processes.
Rather than switching between separate tools, engineers can correlate RTOS activity, interrupts, profiling information, and application behavior within a single debugging environment.
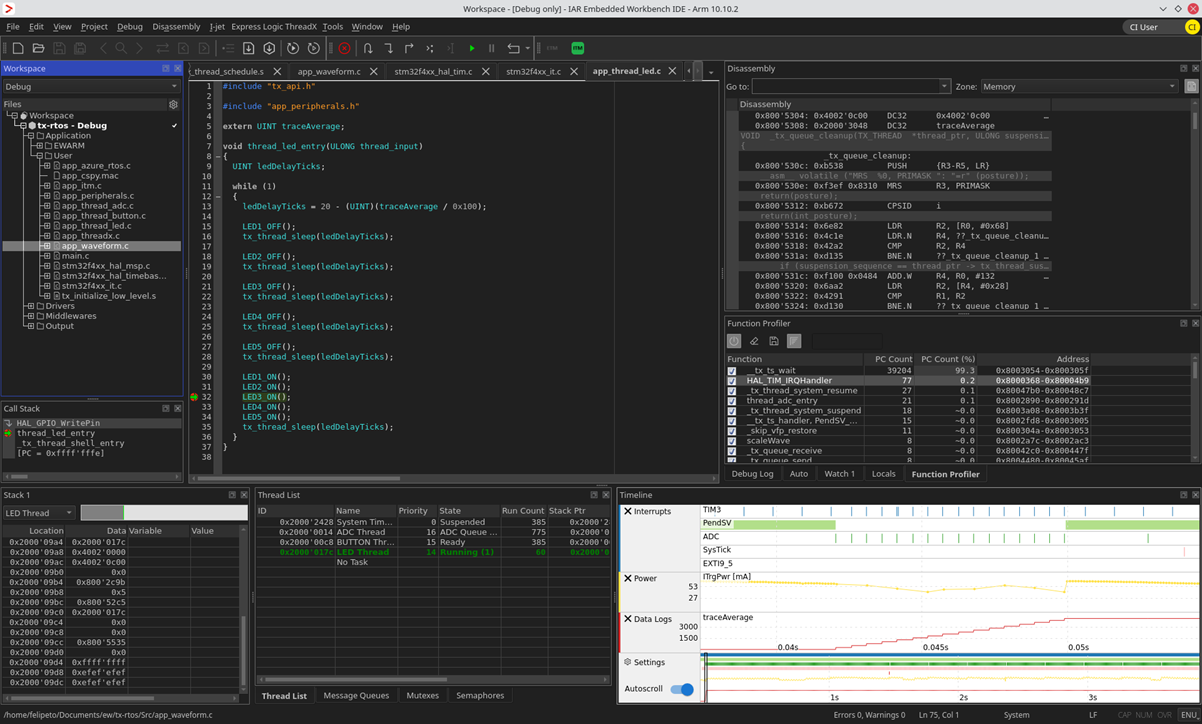
Figure 3. RTOS-aware debugging in C-SPY combines thread scheduling, profiling, interrupt activity, synchronization objects, and timeline analysis in a single workspace. The same debugging experience is available on both Linux and Windows, allowing development teams to standardize workflows across desktops, containers, and CI/CD environments.
For engineering leaders, this has a practical cost angle. Fewer Windows machines and virtual machines kept alive for debugging means simpler lab and CI infrastructure, with less to license, patch, and maintain. It also shortens the path from a field report to a root cause. That matters most when a timing issue surfaces days before a release, or when a customer-reported failure is costing far more than one caught in the lab would have.
The same project that is debugged on Linux can be built from one CMake definition on developer workstations and in CI pipelines. The CMake blog covers that workflow in more detail.
See Embedded Systems in Motion
A breakpoint gives a frozen snapshot. Complex failures need a timeline.
Explore how trace, RTOS awareness, and timeline analysis work together in the interactive IAR Embedded Development Platform demo.
Related Articles