Few phrases are more misused in software, whispered in social channels, promised over the negotiating table or shouted out loud in blogs, as the words "The next release will make everything better!"
So... I won't say that.
But...
Qt 5.2 introduces a new renderer to the Qt Quick Scene Graph.
When we set out to do the scene graph some three years ago, one of my visions was that we would be able to really take advantage of OpenGL and have game-like performance. The renderer we have in Qt 5.0 went a long way towards that goal. For opaque content, we sort based on state and render content front-to-back to minimize GPU overdraw. In the playground/scenegraph repository, we have a different renderer which batches similar primitives together to reduce the number of draw calls (which implicitly also reduces state changes).
The new renderer in Qt 5.2 combines both of these techniques and also tries to identify non-changing parts of the scene so they can be retained on the GPU. Qt 5.2 also adds the texture atlas support which was previously located in the playground/scenegraph's customcontext. This greatly helps batching of textured content. I think that with Qt 5.2, we are now pretty close to that goal.
A new doc article explaining the renderer in more detail has been added for the more curious, though a deep understanding of the renderer is not needed to write well-performing applications. However, I suspect many people will still find it interesting.
http://doc-snapshot.qt-project.org/qt5-stable/qtquick-visualcanvas-scenegraph-renderer.html
There are still a lot of other ideas that could be employed for those who want to have a stab at it. If you have ideas, ping "sletta" on IRC or clone and start coding.
Now some numbers:
Three of the benchmarks are available here: https://github.com/qtproject/playground-scenegraph/tree/master/benchmarks
- Extreme Table contains a large static table with some animated content on top. It shows the benefit of the GPU retention.
- List Bench shows a number of simultaneously scrolling lists with an icon, alternating background color, and two texts per cell.
- Flying Icons contains over 3000 images which are being animated with a unique animation per item.
I also included the front-page of the Qt Quick Controls gallery example and Samegame. Samegame is played in "Zen" mode while clicking to the rhythm of "Where Eagles Dare" by Iron Maiden. (I know... very scientific)
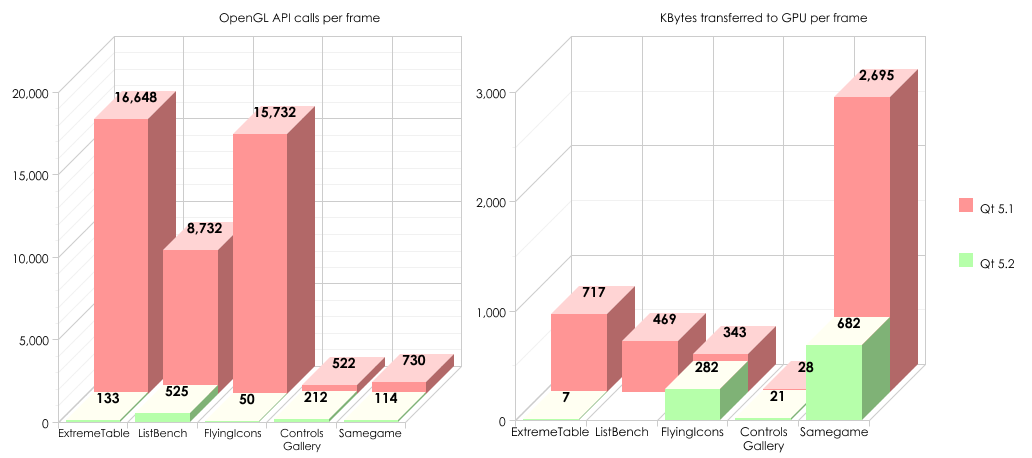
The number of OpenGL draw calls and amount of traffic is measured using apitrace, an awesome tool if you're debugging OpenGL. As can be seen by the green numbers, we've managed to cut down the number of glXxx calls quite a bit, especially for the cases where we have plenty of re-occurrence, meaning lists, tables and grids.
The amount of traffic per frame is also significantly improved. The best examples are the "ExtremeTable" and "ListBench" which are sampled at a frame where no new delegates were being added or removed. I'm quite happy that the "ListBench" comes out as a zero-transfer frame. There is of course some traffic, the draw calls themselves and a couple of uniforms; but no vertex data and no texture data, which is what the tool measures. "FlyingIcons" changes the entire scene every frame so nothing can be retained, so minimal difference is expected. Controls Gallery is mostly static, but has an animated progress bar which needs a new texture every frame. This is the majority of the 20+kb transfer. Samegame comes out pretty high, primarily because of its extensive use of particle systems. A lesson learned is that if you are on a tiny memory bus, limit your particles.
These are theoretical numbers, but they give a good idea that the new renderer is on the right track. Let us look at numbers from running on hardware. I've created tables out of the cases where the new renderer had the most impact. The full table of numbers is at the very bottom.
Note, these benchmarks are run without the new V4-based QML engine. This is because the V4 engine also affects the results and I wanted to focus on rendering only.
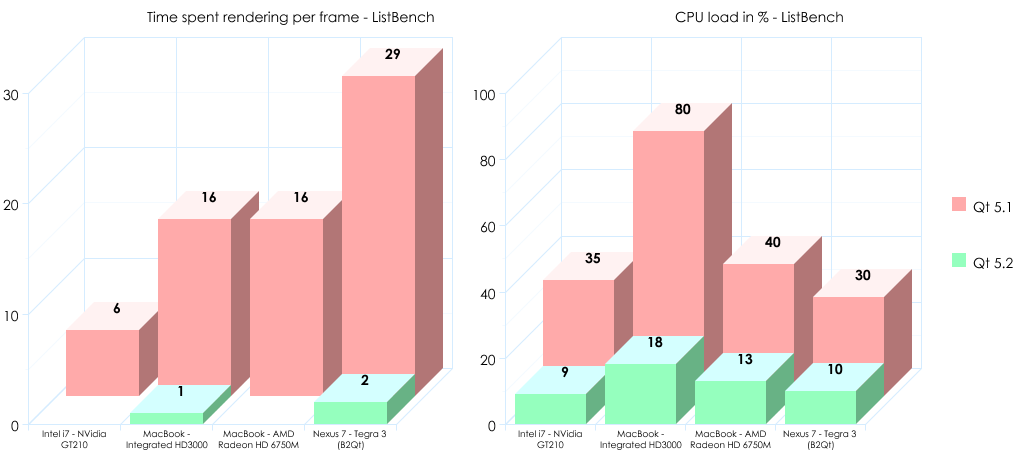
The rendering time is measured with vsync enabled, but excluding the swap. So when we see that the MacBook spends 16ms rendering, it is actually being throttled while we are issuing OpenGL commands. When Iooked at this in Mac OS X's Instruments, I saw that the driver was spending a lot of time in synchronous waiting, aka we have stalling in the pipeline. With the Qt 5.2 rendering, the synchronous waiting while drawing is gone. This is good news, as lists and list-like content is quite common in UIs.
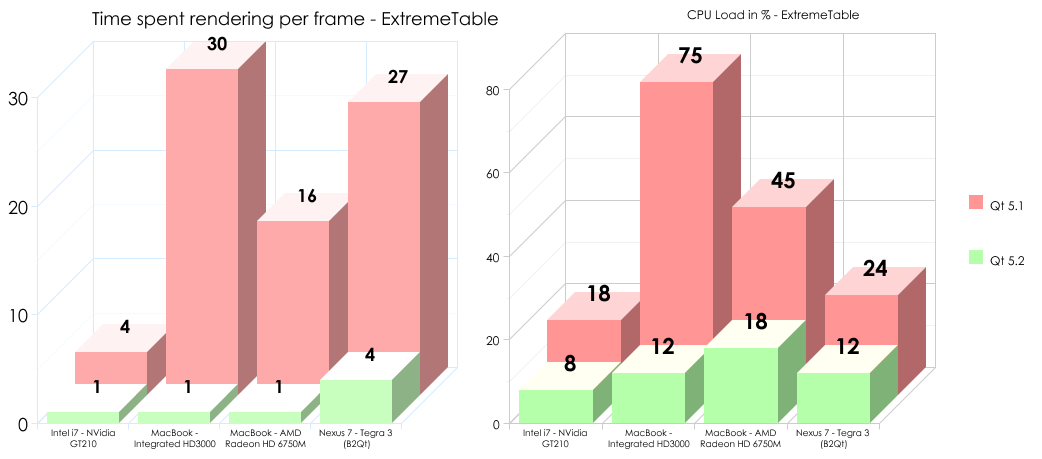
In both the MacBook with Integrated chip and on the Nexus, the new renderer drastically reduces the time spent issuing OpenGL commands. It should also be said that the only reason the render times for the "ExtremeTable" did not go all the way to 0 is because of https://bugreports.qt-project.org/browse/QTBUG-32997
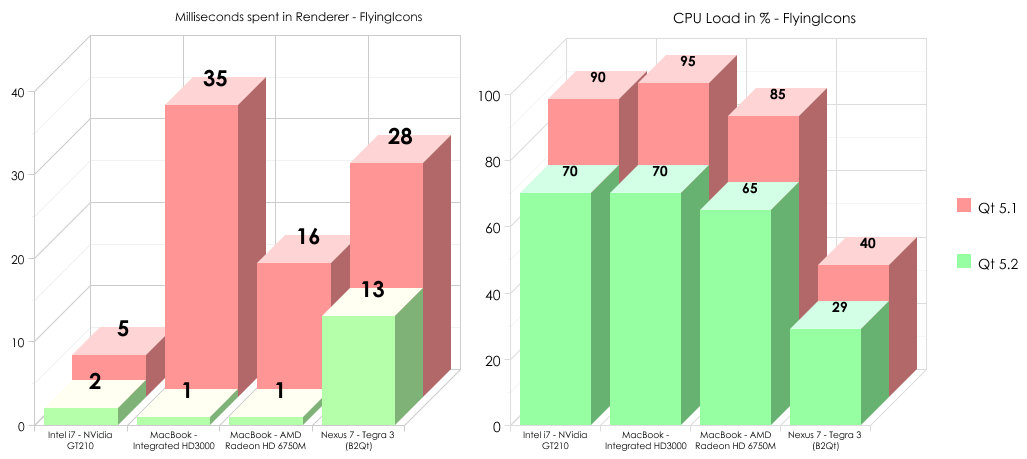
"FlyingIcons" high CPU load is mostly primarily due to it running 3000+ animations in parallel, but as we can see from the time spent in the renderer, that there is still significant improvement.
Here are the rest of the numbers:
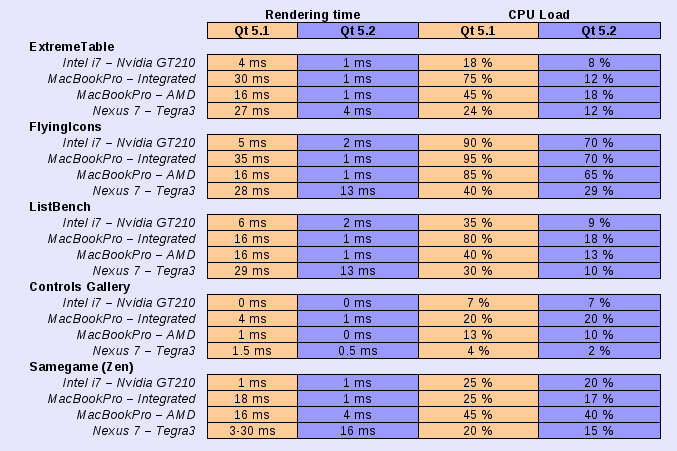
So this matches up pretty well with the theoretical results at the beginning. For reoccurring content, such as lists and grids, Qt 5.2 is quite an improvement over Qt 5.1. For those use cases we didn't radically improve, we at least didn't make them any worse.
Enjoy!