

Webinar: Designing for Modern Devices - Challenges and Trends for Designers of Embedded Applications
Join Qt Group, Creative Navy & Create Next to uncover the future of designing for embedded devic...
Watch Video
Webinar: When Healthcare HMI and Hardware Fail: Lessons in Building Safe, Compliant, and Future-Proof HIT Systems
This webinar is part of a two-part series that explores how medical Human–Machine Interfaces (HMIs) ...
Watch Video
Webinar: How to 10x Development Speed when Building an ADAS HMI Towards Production
Surround Reality (SR) is rapidly gaining traction because it provides the situational awareness toda...
Watch Video
Webinar: Safe, Smart, Seamless: Navigating HMI Hurdles in Lab Equipment
This webinar is part of a two-part series that explores how medical Human–Machine Interfaces (HMIs) ...
Watch Video
Webinar: Qt for MCUs vs. LVGL: A Comparative Study from Design to Deployment
Listen to Qt Group and Spyrosoft for a practical comparison of Qt for MCUs vs. LVGL. See real-world ...
Watch Video
Webinar: Leading into 2026: Insights for the Software-Defined Vehicle era
The software-defined vehicle (SDV) era isn’t coming, it’s already here. But this shift is creating a...
Watch Video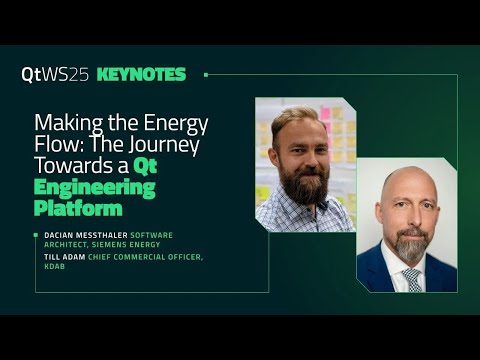
Making the Energy Flow: The Journey Towards a Qt Engineering Platform
In the era of energy transition – with an intensified global demand for sustainable energy solutions...
Watch Video
Qt 6.10 Major Feature Updates
Qt 6.10 is now available, featuring new enhancements for application developers and device creators!...
Watch Video
Qt World Summit 2025 - Qt 3D Engine
In this demo, Ciro Barone, Senior Design Lead at Qt Group, introduces a 3D world created with the Qt...
Watch Video
The FACE® Approach: Cost Reduction through Portability and Interoperability
The unsustainable rise in defense system acquisition costs has driven the creation and enthusiastic ...
Watch Video
Sauber - Qt World Summit 2025
From optimization of the pit stop operations to aerodynamic design and driver training, Qt technolog...
Watch Video
Qt 6.10 Released!
Qt 6.10 is here! This release highlights ready-made accessibility capabilities - all also cross-plat...
Watch Video
Webinar: What it Takes to Build Competitive Two-Wheelers
Hear from experts from Qt Group, Simple Energy, and Crossware as they share practical strategies for...
Watch Video
Qt World Summit 2025 - Mobility Experience
Discover the power of Qt in creating immersive experiences. In this demo, we showcase a single-perso...
Watch Video
Qt World Summit 2025 - Echocardio with Nvidia AI
Discover how advanced graphics and 3D capabilities can make Medical device usage more intuitive and ...
Watch Video
Qt World Summit 2025 - Outrun XR
Outrun XR demonstrates how you can transform a Qt application into immersive, virtual, and mixed-rea...
Watch Video
Qt Search and Rescue Project
From 3D maps and fluid graphics to real-time data from vehicles and personnel, Qt offers advanced re...
Watch Video
Bringing COTS to MOSA: Adapting the Qt Framework to the FACE® Approach
Qt Group adapted the Qt Framework to the modular open systems approach as the Qt for MOSA product. Q...
Watch Video
Metso - Qt World Summit 2025
Learn how Metso uses Qt to modernize the user experience of their industrial machines.
Watch Video
Webinar: Developing Qt with Agentic AI
This webinar will give you an update on the current strengths and weaknesses of AI-assisted Qt devel...
Watch Video
Graebert - Qt World Summit 2025
Learn how Graebert uses Qt Framework to create CAD desktop, mobile, and cloud solutions for its cros...
Watch Video
Schaerer - Qt World Summit 2025
Discover how Schaerer, a leading manufacturer of fully automated professional coffee machines, uses ...
Watch Video
The EU Cyber Resilience Act - Are You Prepared?
The EU Cyber Resilience Act (CRA) is set to reshape the way products with digital elements are desig...
Watch Video
TeamViewer - Qt World Summit 2025
Explore how TeamViewer leverages the power of Qt to deliver seamless remote access and control for e...
Watch Video
Keurig - Qt World Summit 2025
Discover how Joshua Wilkie, an experienced developer at Keurig Dr. Pepper, builds powerful, visually...
Watch Video
Maximize ROI and Streamline Development with Qt
Modern development demands agility, performance, and a seamless user experience across platforms and...
Watch Video
Webinar: Accelerating Industrial AI Applications
Artificial intelligence is redefining industrial automation—driving the evolution toward modular, so...
Watch Video
Data Modul - Qt World Summit 2025
Learn how Qt helps Data Modul save time and costs for the creation of Industry-grade displays and HM...
Watch Video
Harman - Qt World Summit 2025
Learn how Harman uses Qt Framework for Automotive HMI development and as an accelerator to unlock co...
Watch Video
Qt World Summit 2025 - Eclipse Two-Wheeler Reference HMI
Deliver cutting-edge functionalities on cost-effective platforms by leveraging Qt for MCUs optimized...
Watch Video
Qt World Summit 2025 - Industrial IoT Project
Learn how to use Qt Group's Technology for Industrial IoT to optimize factory operations and increas...
Watch Video
Webinar: Next-Gen Two-Wheelers: Premium User Experience (UX) on Practical Hardware
In this webinar, we explore key trends shaping the future of 2-wheeler HMI design: the move to large...
Watch Video
Webinar: What the CRA Requirements Mean for You
CRA is coming - are you ready? The EU Cyber Resilience Act (CRA) is the latest addition to the Europ...
Watch Video
Siemens - Qt World Summit 2025
Learn how Siemens uses Qt Framework in Industrial Automation for its industrial stability, robustnes...
Watch Video
Bosch Software and Digital Solutions - Qt World Summit 2025
Learn how Bosch Software and Digital Solutions partners with Qt to help global customers accelerate ...
Watch Video
Shaping Tomorrow: Cutting-Edge Innovations and Trends in Digital Experiences
Artificial Intelligence and Cybersecurity. Efficiency and Ecosystem. How will Qt address these issue...
Watch Video
Customer Case: Harman – The Kaleidoscope Approach to Scalable HMI Development
Join Roman Leykin on a unique journey inside a kaleidoscope — a vivid analogy that reveals the key p...
Watch Video
Customer Case: Vorwerk
Discover how Qt is transforming a device used by millions on a daily basis into an even better compa...
Watch Video
Customer Case: Siemens
Explore Siemens customer case on Simatic Unified Comfort Panels using the Qt framework. How to balan...
Watch Video
From Cyber Security to Cyber Resilience: The Necessary Shift
As the cyber threat landscape around us evolves, the focus must shift from traditional cyber securit...
Watch Video
Using AI Assistants for Qt UI Development
QML coding performance of Large Language Models (LLMs) has a direct impact on the adoption of AI ass...
Watch Video
Qt Group's Journey to EU CRA Compliance
Embark on a journey with us as we navigate the path to EU CRA compliance at Qt Group. Discover how t...
Watch Video
30 Years of Graphics Rendering in Qt - A Whirlwind Tour
The evolution of Qt's UI rendering: From the native paint engines in Qt 1/2/3, to Qt's own software ...
Watch Video
Creating Immersive AR and VR Applications with Qt Quick 3D XR
A practical introduction to the new XR module in Qt, with code. Showing how to get started, how to u...
Watch Video
The Great Migration: Transferring Millions of Data Objects to QML with Speed and Comfort
In this talk, Furkan will present how millions of data objects have been migrated from Alias to QML,...
Watch Video
Common Graphics Performance and Rendering-Related Issues when Moving from Qt 5 to 6
Qt 6.0 introduced some important changes in the Qt graphics stack, further followed in the 6.x serie...
Watch Video
Simplifying Your C++ Applications: Bridging Qt with Python and Beyond
In an era of multi-language development, frameworks must evolve to meet the demands of modern develo...
Watch Video
QML Modules for the Masses
qt_add_qml_module creates proper QML modules from CMake. But what are QML modules? And why should yo...
Watch Video
Speed Up Your Remote Communication with Qt GRPC & Qt Protobuf
Qt GRPC and Protobuf are the new kids on the block in the Qt ecosystem. In this talk, we will explor...
Watch Video
QML Hot Reload: A Deep Dive
Dive into the (technical) foundation of Felgo Hot Reload, exploring the use of QML scene graph, Qt p...
Watch Video
Crossing the QtWidgets to QtQuick Bridge
For historical reasons, QtWidgets and QtQuick applications tend to use very different software archi...
Watch Video
Creating Threaded Item Models for Large Views
Useful examples and patterns for handling large amounts of data in UI views without sacrificing the ...
Watch Video
Breaking new Ground: Porting of Qt to new Platforms
In an era of rapid technological evolution, Siili Auto stands at the forefront of cross-platform inn...
Watch Video
Rust Code in Qt Applications: Challenges and Solutions
Qt developers wanting to use Rust in their applications face unique challenges due to Qts extensive ...
Watch Video
Qt for WebAssembly and Dynamic Linking: Expanding Web Application Potential
This talk explores how Qt leverages WebAssembly to bring native-like performance and capabilities to...
Watch Video
GammaRay: A Visual Debugger for Qt Applications
GammaRay is an open source "high-level debugger" for Qt. It is able to show the status of various Qt...
Watch Video
Mastering Qt Multithreading Without Losing Your Mind
In this session, we'll demystify Qt multithreading by exploring key concurrency methods, from QThrea...
Watch Video
How to Easily Bring 3D to Existing Android Applications
Easily adding Qt to native Java and Kotlin Android applications opens up many new possibilities for ...
Watch Video
Engineering the Thermomix® TM7 HMI: Practical Insights into Scalable Qt Development
If you're serious about HMI architecture, this talk will provide practical insights you can apply di...
Watch Video
Webinar: Securing the Connected Industry – Navigating EU Cybersecurity Regulations and Best Practices
The webinar explored the importance of cybersecurity in product development and certification, highl...
Watch Video
Webinar: AI, Robotics, and the Future of Smart Manufacturing
This Visionary Voices of Tech webinar on AI, robotics, and smart manufacturing features experts from...
Watch Video
Webinar: Qt 6.9 Major Feature Updates
Qt 6.9 is available, featuring new enhancements for application developers and device creators! This...
Watch Video
Qt Deep Dive: Insider Perspectives for Medical Software Innovation
Watch this fireside chat featuring two trusted experts in the MedTech sector and gain actionable ins...
Watch Video
Qt 6.9 Released!
Qt 6.9 is here! This release brings exciting innovations, enhanced graphics performance, and new pla...
Watch Video
From Concept to Care: UX and Software Development for Next-Gen Medical Devices
Discover how innovative software development and user interface (UI) design are transforming medical...
Watch Video
Accelerated GUI Development and Testing in the Cloud: A Software-First Approach
Check out Qt Group's AWS theatre talk from CES 2025.
Watch Video
Webinar: End-to-End Tooling for Connected Industrial Vehicles
Welcome to our "Driving Digital Transformation in Industrial Vehicles" webinar series! In this secon...
Watch Video
Siemens PAVE360™ | Built with Qt
In partnership with Qt Group, Siemens uses Qt Automotive HMI to bring its digital twin solution PAVE...
Watch Video
Reuters Events On-Demand Webinar: Maintain Market Competitiveness Through Your In-Vehicle Entertainment
This webinar is in conjunction with Reuters Events: Automotive Europe 2025. In this webinar, the pan...
Watch Video
Webinar: High-Performance Graphics for Industrial Vehicles’ Digital Twins
Welcome to our "Driving Digital Transformation in Industrial Vehicles" webinar series! In this first...
Watch Video
Webinar: Building Exceptional 3D Embedded Experiences with Qt
Discover how the demand for 3D within industries has surged due to advancements in technology, acces...
Watch Video
Webinar: Transforming Industrial Vehicles through Technology and Innovation
In this webinar, experts from Qt Group, Novatron, Infineon, and Calm Tech Institute come together to...
Watch Video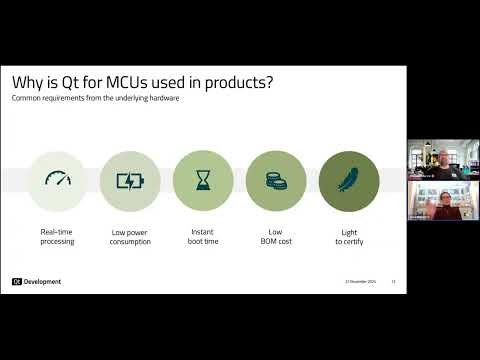
Webinar: Innovative GUI Solution for Resource-Limited Embedded System
In this session learn how to overcome the traditional issues related to graphical user interface (GU...
Watch Video
Webinar: Safe and Effective Medical Devices Built with MCUs
Ever wondered about medical devices built with microcontrollers (MCUs), especially in today's world ...
Watch Video
Webinar: Qt 6.8 Major Feature Updates
In this webinar, we cover updates to the following modules that comes with the release of Qt 6.8.: Q...
Watch Video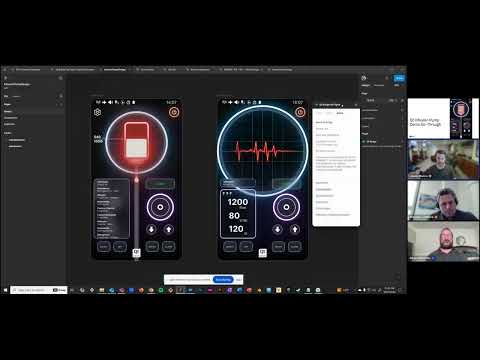
Webinar: Optimize Medical Device Development with a Streamlined Workflow
In this webinar, we showcase the development of a medical infusion pump, highlighting the practical ...
Watch Video
Increase Medical Device Productivity, Quality, and Efficiency with Platform Engineering
As the need to integrate more and more advanced functionality within digital devices increases, soft...
Watch Video
Qt 6.8 Released
Qt 6.8 LTS is here! 🚀 Focused on key tech trends like spatial computing & XR, 2D/3D data visual...
Watch Video
Webinar: Foster High-Quality Embedded Software Development
Discover what over 300 embedded software decision-makers and influencers have to say about platform ...
Watch Video
Webinar: How to Enhance a Digital Twin and Create 3D Tests for it Using Qt Tools?
In this webinar, discover how to enhance 3D scenes by building on a digital twin, explore lighting a...
Watch Video
Webinar: Revolutionizing Healthcare: The Future of Intuitive Medical Devices
In this Visionary Voices of Tech Webinar, watch experts–Kris Dickie, Chief Technology Officer (Clari...
Watch Video
Qt 6.7 Released!
The release of Qt 6.7 is packed with many UI and backend development enhancements. Join our technica...
Watch Video
Build the Future of Industrial Automation: Showcasing Qt Group's New High-Impact Demo
Building on our customer experience and analysis of the industry trends, several teams of UI/UX desi...
Watch Video
Navigating the Future Landscape of Industrial Automation Excellence
Join experts from Bosch Global Software Technologies, Konecranes, and Qt Group as we explore the fut...
Watch Video
How To Use QML in Qt6 | User Interface | #QtWS21
This talk will show how to best use the new CMake API for QML modules, declarative type registration...
Watch Video
Webinar: The Contest for Al Dominance: Decoding Al & The Race for Tomorrow's Tech
In the ever-changing world of technology, discussions about artificial intelligence (AI) have become...
Watch Video
Qt for MCUs on Renesas RA8-D1
Qt Group announces tech-preview support for Renesas RA8-D1 microcontroller platform, the industry’s ...
Watch Video
Qt Graphs: A New 3D Graph Rendering Module with Kwanghyo Park | #QtWS23
Abstract: We are introducing a new Qt module to draw 3D graphs. It is a new generation of an existin...
Watch Video
Script Automation: Recording User Actions with Nicolas Arnaud-Cormos | #QtWS23
Abstract: QML is a versatile and powerful component of all Qt applications, beyond the already estab...
Watch Video
Porting a Large Scale Non-Qt Legacy CAD Application to Qt/QML: The Good, The Bad, and The Ugly
Abstract: Over the last 3 years, we have been working on porting our large legacy CAD software (Alia...
Watch Video
Qt Development for macOS: Tips and tricks with Lukas Kosiński | #QtWS23
Abstract: Dive into the world of Qt development for macOS with this insightful talk, designed to emp...
Watch Video
KDE's Journey to Qt6 and Beyond with Nicolas Fella | #QtWS23
Abstract: The KDE community has been developing free software using Qt for over 25 years. Naturally,...
Watch Video
Getting Qt to run on new MCU environments with Bruno Vunderl | #QtWS23
Abstract: Unlike desktop application environments that provide (more or less) stable APIs on how to ...
Watch Video
The Role of Language Bindings in the Future of the Qt Ecosystem with Cristián Mauraira-Fredes
Abstract: Qt and Python are around the same age, but both technologies evolved independently. The mo...
Watch Video
QML Code Reload: Discover What’s New with Alex Leutgöb | #QtWS23
Abstract: Code reloading is a technique that allows developers to update the application’s source co...
Watch Video
Recent Changes to the QML Language with Ulf Hermann | #QtWS23
Abstract: QML has recently gained a number of new features: Named user-provided value types and cont...
Watch Video
Mixing Reality with Qt with Kamil Machnicki, Krzysztof Kurzeja & Łukasz Ronka | #QtWS23
Abstract: Dive into the integration of eXtended Reality (XR) technologies with Qt, the leading cross...
Watch Video
Integrating Qt Interface Framework with Qt Design Studio with Marcin Pawlikowski | #QtWS23
Abstract: Qt Interface Framework is a powerful tool that allows for the separation of frontend and b...
Watch Video
Qt Quick: Tips and Tricks with Andy Nichols | #QtWS23
Abstract: QML, Qt Quick, and Qt Quick Controls have all been evolving over the lifetime of Qt 6. Whi...
Watch Video
The non-zero-sum approach to HMI UX/UI development with Patrick Thurman | #QtWS23
Abstract: As the whole industry is ripe for adapting a software-defined vehicle strategy (SDV), some...
Watch Video
Unleashing the Power of Qt and MVVM for Custom UI Development: From View to ViewModel and Back!
Abstract: This talk will focus on the MVVM approach to UI development using the Qt framework, specif...
Watch Video
Qt Smart Home Demo: Digital Reshaping the Everyday Life with Xavier Claro | #QtWS23
Abstract: Digital user experiences have become a defining factor in the highly competitive market of...
Watch Video
Creating Controls from Figma Design with Brook Cronin & Vikas Pachdha | #QtWS23
Abstract: Vikas and Brook will take you on a tour through the process of designing and creating cont...
Watch Video
How Qt Tools Help with Compliance for Software Safety and Cybersecurity with Erwan Coz | #QtWS23
Abstract: Most industries need to take into account safety and cybersecurity problems during their p...
Watch Video
A Vision of Future Collaborative Qt Quality Assurance in Distributed Teams with Rainer Koschke
Abstract: This presentation provides a near-future vision of how quality assurance can look like whe...
Watch Video
Integration of UX Into HW/SW Co-Design Analysis Infrastructures with Andreas Aal | #QtWS23
Abstract Using virtual environments in flight and driving simulators is an established way to derive...
Watch Video
Panel Discussion: Is Software Making the Lives of Developers Easier? with Kate, Kevlin, & Volker
Panel Discussion: Kate Gregory, Kevlin Henney, and Volker Hilsheimer
Watch Video
Customer Case: Mercedes-Benz with Victoria Fischer | #QtWS23
Abstract: Mercedes Benz is using Qt to build its world-class MBUX, allowing pixels to be pushed at t...
Watch Video
From Code to Influence: The Road to Staff Engineer at Sky with Jonathan Courtois | #QtWS23
Abstract In today’s tech landscape, the notion of progression often pivots towards management roles....
Watch Video
Qt Roadmap with Volker Hilsheimer & Maurice Kalinowski | #QtWS23
Abstract: How does the roadmap of Qt Development looks like? What to expect in upcoming months? Qt C...
Watch Video
Enhancing Embedded Device Development: Streamlining the DevOps Pipeline with Marko Klemetti | QtWS23
Abstract: In the rapidly evolving world of embedded development, effective DevOps practices are more...
Watch Video
Customer case: Konecranes with Eugenio Torrini | #QtWS23
Abstract: We were talking about containers way before Docker existed, we have modularity and reusabi...
Watch Video
Luma Vision - The Future of Interventional Cardiac Imaging (Built with Qt) | #QtWS23
Abstract: At LUMA Vision we are building a future in which Cardiologists and Electrophysiologists ha...
Watch Video
Trends in Product Creation - Open Software, Tools, and Frameworks with Tuukka, Volker & Aleksina | #QtWS23
Abstract: The evolution of the Qt Ecosystem, Open Software, Open Tools, and Open Frameworks. We will...
Watch Video
Webinar: Shaping HealthTech: Data Security, Modernization, and Beyond
The healthcare industry is undergoing a rapid transformation as new technologies, regulations, and c...
Watch Video
How to Seamlessly Migrate Qt from an MPU to an MCU
Learn how Qt for MCUs can help you whenever your embedded application needs real-time processing, op...
Watch Video
Webinar: What's New in Qt 6.6
The release of Qt 6.6 is packed with many UI and backend development enhancements. Join our technica...
Watch Video
Rev Up Reality with Qt Best-in-Class Real-Time Rendering Capabilities
Enjoy game-engine-like graphics on resource-constrained embedded systems. With its high-performance ...
Watch Video
Webinar: Driving the Future - Key Trends Shaping the Automotive Industry
What lies ahead for the automotive industry? Which trends and technologies are shaping the landscape...
Watch Video
High performing Qt GUIs on STM32 Microprocessors
Learn how to deploy Qt on top of STM32MP157 with a dedicated GPU and the STM32MP135 for simpler GUI ...
Watch Video
Qt 6.5 LTS Technical Features Overview
In this webinar we will introduce you the main new features coming with the Qt 6.5 LTS releases. We ...
Watch Video
SmartHome | Built with Qt
Transforming home appliances into smart-devices capable of helping users in their daily routines and...
Watch Video
Top 5 UI/UX Trends Shaping the Future
In today's fast-paced digital landscape, creating exceptional user experiences is crucial for succes...
Watch Video
Qt 6.5 LTS Release - Enabling stunning and immersive experiences
Take a look at a quick overview of what's new in the Qt 6.5 LTS Release with Product Director Mauric...
Watch Video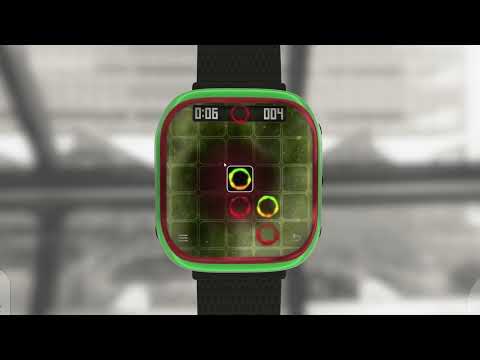
Qt Quick Effect Maker - Smart Watch Demo
Take a look at the latest from the Qt Quick Effect Maker in this Smart Watch Demo. Read more.
Watch Video
Porting a Large Desktop CAD Application to Qt
BricsCAD is a cross-platform desktop (linux/mac/windows) CAD application with over 20 years of histo...
Watch Video
Insights Into Graphics Innovations at Infineon’s Traveo™ 2nd Gen MCU
The speech provides some insights into the graphic modules and features used at Traveo™ 2nd Generati...
Watch Video
Working with Qt in a Regulated Industry
This talk discusses developing medical devices at GE HealthCare in a regulated environment, and the ...
Watch Video
Qt Design Studio – Designers in the Development Cycle
Developing a 3D scene for limited hardware: this talk will try to showcase the benefits for designer...
Watch Video
Taking 3D Content to the Next Level with Physics, Global Illumination, Reflections and Spatial Audio
Qt Quick 3D is a high-level Qt API for creating 3D scenes that can be seamlessly combined with 2D UI...
Watch Video
KDE Eco: Achievements, Impact, and To-Do's
Given Free and Open Source Software's core values of transparency and user autonomy, FOSS has an edg...
Watch Video
How Not to Design Reusable Components in QML
Reusable components are at the heart of QML and any other type of UI programming. The success of you...
Watch Video
Qt World Summit 2022 Opening Address
In this opening keynote address, Juha Varelius, CEO will give an overview of what’s been happening a...
Watch Video
Qt and WebAssembly Takes Client Development Mainstream to the Web | #QtWS22
Qt has made substantial investment in WebAssembly in recent years. Many developers and observers ini...
Watch Video
Developing a Unified Mobile and Desktop App with Qt | #QtWS22
The distinction between mobile and desktop applications is becoming increasingly blurred. Convertibl...
Watch Video
Integrating Custom Rendering Engine with QML Quick | #QtWS22
In this talk, we will take a close look at how to seamlessly integrate a fully custom OpenGL renderi...
Watch Video
Hands-On Tour of Embedded Linux System Calls In Qt | #QtWS22
While Qt offers tremendous functionality in performing system level tasks in the framework via C++, ...
Watch Video
ChargePoint EV Charging and Qt WebAssembly - Virtually Everywhere | #QtWS22
ChargePoint utilizes Qt+WebAssembly to provide an online simulation of our EV Charging UI using the ...
Watch Video
Qt and C++20 | #QtWS22
When Qt 5.0 was released, it was the first version to require C++98 compliant compilers. Qt 5.7 then...
Watch Video
How to Access Android API from QML With No Effort | #QtWS22
This talk will show how Spyrosoft is using the Qt Interface Framework and AIDL to expose Android API...
Watch Video
Highlights from Qt Widgets and More | #QtWS22
This presentation is both for Widgets and QML developers! Qt Widgets and More is a YouTube series wi...
Watch Video
Qt Bridge Plugins in Depth | #QtWS22
Qt Design Studio (QDS) helps you makes the leap from design to concrete UI. The Qt-Bridge plugin is ...
Watch Video
Tips and Tricks for Testing Large Projects with the Qt Test Framework | #QtWS22
Building large-scale, feature-rich projects that run on multiple platforms poses many testing challe...
Watch Video
The New Qt Quick Compiler Technology | #QtWS22
Since Qt 6.2, we have gradually phased in the new Qt Quick Compiler Technology. Using the overhauled...
Watch Video
QML Hot Reload in Practice - How to Get More Productive with Code Reload | #QtWS22
Bringing a great User Experience for your product is hard. And often, we don't spend our time workin...
Watch Video
Making Qt Quick Controls in Qt Design Studio from Figma Variant Components | #QtWS22
In this session, Brook will show how to setup a project consisting of a set of template files, based...
Watch Video
Achieving Limitless Scalability
How to create sophisticated, user-friendly applications that work across multiple devices and operat...
Watch Video
The iOS Style for Qt Quick Controls 2 | #QtWS22
Qt Quick Controls applications running on iOS haven't yet had a native-looking style, forcing develo...
Watch Video
Migrating from QMake to CMake | #QtWS22
This talk will show you how to migrate existing qmake projects to CMake. It will also cover the usag...
Watch Video
5 Reasons Why You Should Use the Latest Qt for Python | #QtWS22
C++ has evolved tremendously in the last decade in its quest to become a safer, more elegant languag...
Watch Video
Handling Dates and Times in Qt & Making the Most of Qlocale | #QtWS22
This will be a 2-part presentation. Part 1: This talk will provide an overview of the date, time and...
Watch Video
What You Need to Know to Collaborate Better Between Designers and Developers | #QtWS22
This talk will provide some tips based on the experience of a few of Qt's Technical Artists and Solu...
Watch Video
The Latest on Qt Learning | #QtWS22
This talk will introduce you to the latest updates and plans on Qt Learning: Qt Educational Licenses...
Watch Video
Qt Positioning in Qt 6 | #QtWS22
This talk will discuss the improvements that were made to the Qt Positioning module in Qt 6. It will...
Watch Video
CMake and Qt. qt_add_qml_module in Practice | #QtWS22
The need to switch from qmake to Cmake has caused many Qt developers to have difficulty organizing t...
Watch Video
In Small Packages: Starting from Scratch with Qt for MCUs | #QtWS22
In this talk we will build a simple Qt for MCUs GUI project from scratch with Qt Design Studio and Q...
Watch Video
How Test Automation Can Improve Customer Satisfaction and Accelerate Time-to-Market | #QtWS22
Development costs and release frequencies increase, and you actually have less time for testing than...
Watch Video
10 Years of Rimac In-vehicle Infotainment with Qt
From development kits and a one-man band building the first in-vehicle user interfaces, to series pr...
Watch Video
16 reasons why companies love Qt
Learn more about Qt on our website: https://www.qt.io See why our customers love us as much as we lo...
Watch Video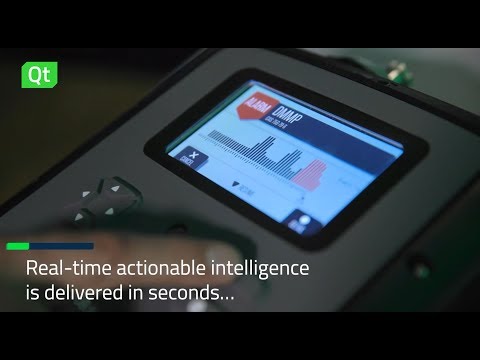
Built with Qt: 908devices reach markets faster and save resources with Qt.
The MX908TM is a multi-mission tool utilized by elite responders conducting chemical, explosive, pri...
Watch Video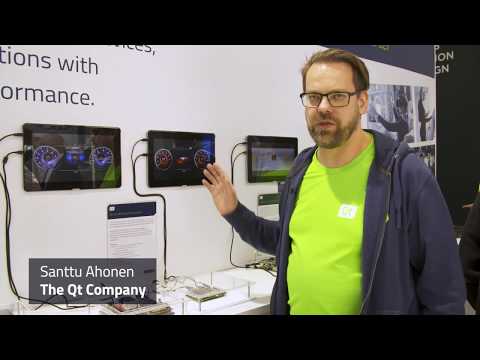
A 3D UI and a 2D UI - Same Code Base, Same Design {showcase}
Santtu shows you how you can develop a 3D UI for higher-end and a 2D UI for lower-end hardware with ...
Watch Video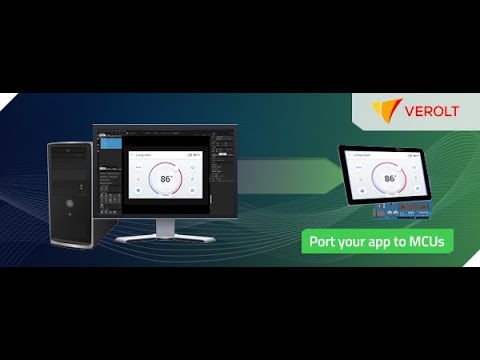
A Guide to porting Qt Quick applications to Microcontrollers using Qt for MCUs {On-demand webinar}
Qt for MCUs allows you to develop Qt applications that run on Microcontrollers. With the help of Qt ...
Watch Video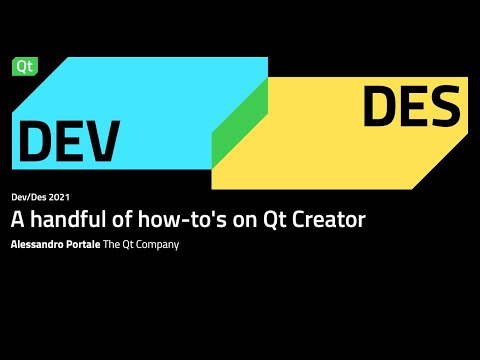
A handful of how-to's on Qt Creator - Dev/Des 2021
www.qt.io https://www.qt.io/product/qt6 Alessandro Portale shares a handful of how-to's on Qt Creato...
Watch Video
A Modern Ubiquitous Approach Across the Complete Product Family {On-Demand Webinar}
Covid-19 has device makers across all industries experiencing record-breaking demand. Home appliance...
Watch Video
Accelerated 2D and 3D Graphics in Qt 6
www.qt.io Laszlo Agocs, Principal Software Engineer at The Qt Company takes a deeper look at the cha...
Watch Video
Advanced 3D features - Dev/Des 2021
www.qt.io https://www.qt.io/product/qt6 With Qt 6, the Qt framework takes a step closer to 3D game e...
Watch Video
Advanced session on Yocto & eLinux {Qt Virtual Tech Con 2020}
This hands-on advanced session on how to edit your B2Qt image and Yocto based Embedded Linux. Samuli...
Watch Video
All the things you need in on Qt box, LASE Industrielle Lasertechnik
An easy-to-use framework, saving development time, and rapid UI prototyping with QML - what's not to...
Watch Video
All You Need to Get Your App Done with Qt for Android | Tools | #QtWS21
This talk shows how to go about developing an Android app using Qt for Android. We'll cover differen...
Watch Video
Amazon Web Services create ROBOT ARM CHALLENGE with MXNet deep learning and Qt {showcase}
This is an Interview and demo with Anton Chernov from Amazon Web Services. Anton shows off the Robot...
Watch Video
Model-based HMI development using Qt
Discover the process to validate the whole system based on the mathematical models even before the h...
Watch Video
Animations and Materials in 3D Scenes with Qt Design Studio
www.qt.io Filip Wasil goes over the basics of Qt Design Studio and how to use it to create a modern-...
Watch Video
Augmedics Xvision project & live Q&A
Asaf Asban and Eliah Ninyo will give an intro to the Augmedics Xvision project – a combination of PC...
Watch Video
Aurora Net: Sound Management and Monitoring System by dBTechnologies Built with Qt
Aurora Net boosts the management and monitoring of your sound reinforcement systems into overdrive. ...
Watch Video
Automagically' turn your design into code - Dev/Des 2021
Ever dreamed about watching your design turn into development-ready code? Well, here’s your chance t...
Watch Video
basysKom Showcases a Qt OPC UA HMI for Industrial Controllers
basysKom's Frank Meerkötter shows off an industrial HMI built with Qt Quick and Qt OPC/UA. Qt OPC UA...
Watch Video
Be even more cross-platform with Qt for WebAssembly!
Qt for WebAssembly is a platform plugin that lets you build Qt applications for the web, with less s...
Watch Video
Best Practices for Qt for MCU | Graphics | QtWS21
The talk will show you the best practices to have in mind when developing multi-threaded GUI applica...
Watch Video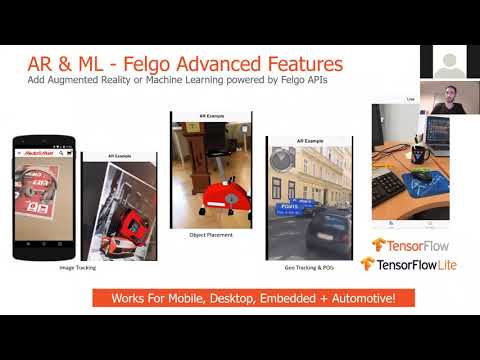
Best Practices for Qt on Mobile (iOS + Android) {Qt Virtual Tech Con 2020}
Whether you want to bring your existing Qt application to Mobile or develop an own Mobile-optimized ...
Watch Video
Best Practices in Writing Applications in QML | User Interface | #QtWS21
This talk shows which rules you should follow to make your Qt Quick application a long-term success....
Watch Video
Best Practices to Improve Your Embedded Product Experience {On-demand webinar}
Creating a great product experience means taking a human-centric approach to software design. Unders...
Watch Video
Better products for Omicron Energy Built with Qt - with Sabariesh Ganesan
Find out how Omicron Energy developed a much better product than their competitors and saved a lot o...
Watch Video
Addressing Medical and Industrial Challenges {On-demand webinar}
The QNX® Neutrino® and its safety variant, the QNX® OS for Safety, are widely regarded as safe and s...
Watch Video
Boost development time for Embedded
Christian Feldbacher, CEO & Co-Founder of FELGO, discusses boost development for embedded device...
Watch Video
Bridging the gap between designers and developers
Thomas Hartmann, Senior Manager R&D, The Qt Company, talks about Qt Design Studio, Qt's 2D and 3...
Watch Video
Bridging the gap between Developers and Designers - Live demo
When creating a working UI (user interface), there is often a disconnect between the Designer’s UI d...
Watch Video
Bridging the gap between UX and development {On-demand webinar}
When you think of what makes a good app, our minds increasingly shift from a pure functionality to t...
Watch Video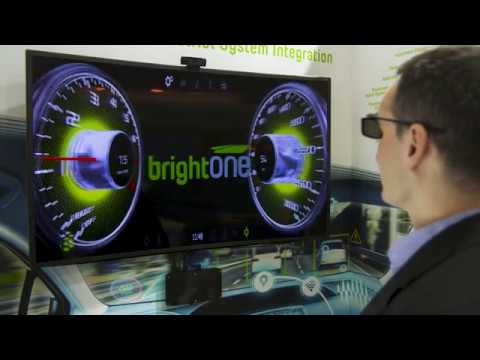
BrightONE 3D HUD for Automotive Built with Qt {showcase}
BrightOne's Piotr Szul shows off a cool new 3D heads-up display for an automotive instrument cluster...
Watch Video
BrightONE's Gesture Control Demo on an Automotive HMI {showcase}
BrightOne's Piotr Szul shows how smooth gesture control on an automotive HMI built with Qt can be.
Watch Video
Build Deep Learning Applications with Qt and Tensorflow Lite - Dev/Des 2021
Only a few decades ago it seemed impossible to automatically classify bird species in images, let co...
Watch Video
Build your first 'Qt for MCUs' application
Qt for MCUs is a complete graphics framework and toolkit with everything you need to design, develop...
Watch Video
Build your first WebAssembly application {Qt Virtual Tech Con 2020}
In this talk we'll take a look at how to get started with Emscripten and Qt for WebAssembly. This in...
Watch Video
Building a Qt Application with Modern CMake and vcpkg
In this webinar, Alexandru will go through the process of building a Qt Quick Controls 2 application...
Watch Video
Building an app with Qt for MCU on top of FreeRTOS {Qt Virtual Tech Con 2020}
Join this webinar to learn how to build an example application that uses M4/M7 cores where: M4 core ...
Watch Video
Building Immersive Environments and UX with Qt Quick 3D | Graphics | #QtWS21
Modern 3D UIs are much more than just 3D objects floating around in empty space. This talk looks int...
Watch Video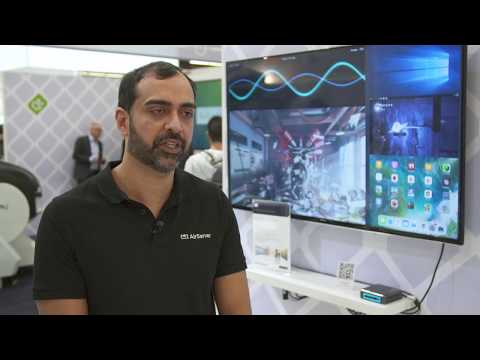
Built with Qt: AirServer Universal Mirroring Receiver
AirServer can transform a simple big screen or a projector into a universal screen mirroring receive...
Watch Video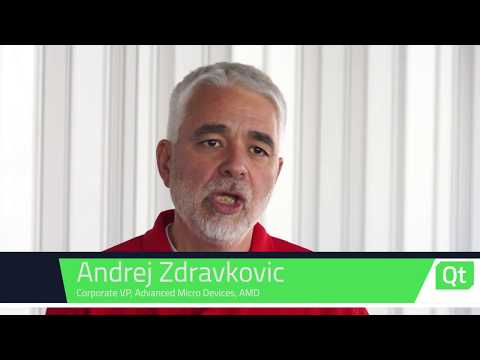
Built with Qt: AMD Radeon Software
Andrej Zdravkovic, Corporate Vice President Software Development and Graphics Platform Solutions at ...
Watch Video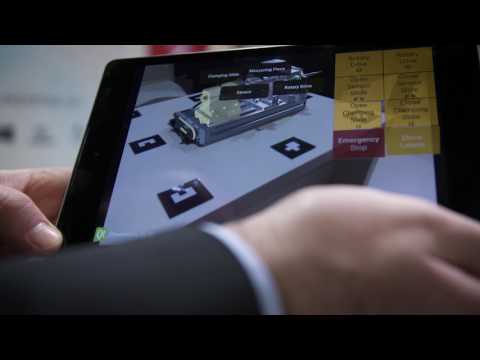
Built with Qt -AR & Non-GPU UI with KDAB
Qt Partner KDAB presents two demos at Embedded World 2017. Augemented Reality based on Qt 3D & N...
Watch Video
Marine & Vehicle Automation: Digital Switching, BEP Marine CZone
Software Engineer, Jeremy Stott with BEP Marine Limited, a Power Products LLC Company, speaks to the...
Watch Video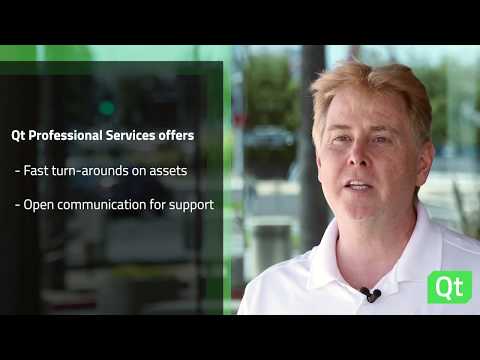
Built with Qt - Drone/Unmanned Autonomous Systems (UAV) Ground Control Station
"I have no hesitations recommending Qt Professional Services to anyone in terms of getting to market...
Watch Video
Built with Qt - Embedded HMI development with basysKom
Qt partner basysKom presents their Qt based Embedded HMI Framework.
Watch Video
Built with Qt: Esri ArcGIS Runtime SDK for Qt
The esri ArcGIS Runtime SDK lets you build native apps with ArcGIS and Qt. Integrate a wide range of...
Watch Video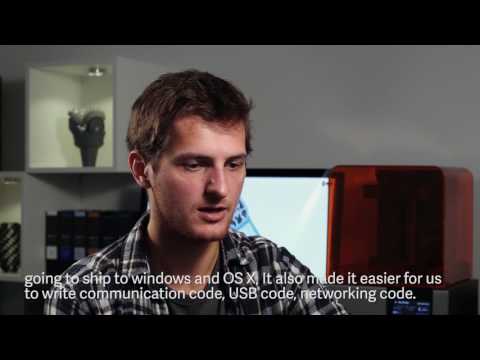
Built with Qt - Formlabs intuitive & connected 3D printing experience
Formlabs designs and manufactures pioneering desktop 3D printers, bringing innovative and sophistica...
Watch Video
Gesture Controlled Qt Automotive Suite HMI, Partner brightONE
Qt Partner brightONE has used Qt Automotive Suite to develop a gesture controlled HMI. Use your hand...
Watch Video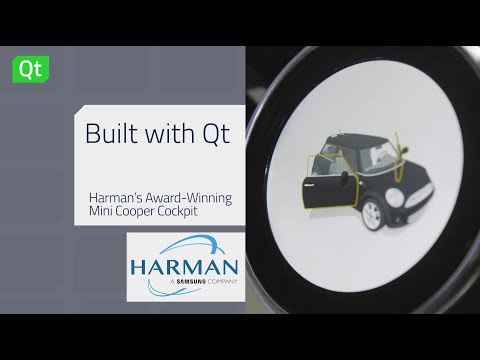
Built with Qt - Harman's Award-Winning Mini Cooper Cockpit
Harman won the reddot award for their HMI design on the Mini Cooper. The infotainment system and ins...
Watch Video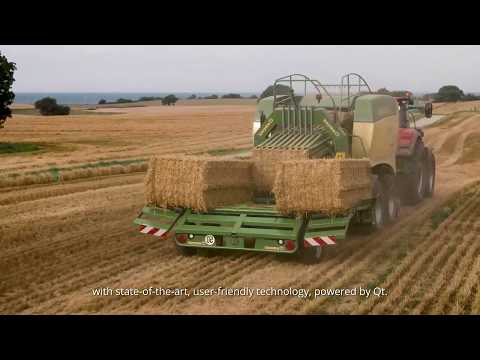
Built with Qt: ISOBUS/CCI Smart Farming with KDAB
Smart farming is not just good for our planet, it's good business too! Competence Center ISOBUS, or ...
Watch Video
Smart Agricultural Machinery Built with Qt: KDAB & AgBrain
For truly smart farming, the agricultural terminals need to allow operators to simply oversee and ha...
Watch Video
LG Consumer Electronics - Built with Qt
LG’s innovative technologies, unique products, and cutting edge designs are built with Qt. We interv...
Watch Video
Built with Qt - Lytro Light Field Imaging Platform
Built with Qt: Lytro is building the world’s most powerful Light Field imaging platform enabling art...
Watch Video
Built with Qt: Meiller tipper truck app with KDAB
The app helps drivers diagnose and fix problems even when they are on the road or at a construction ...
Watch Video
Built with Qt: Mercedes-Benz Generation EQ
The Mercedes-Benz Concept EQ is a one of the concept cars in generation EQ series, which are cars th...
Watch Video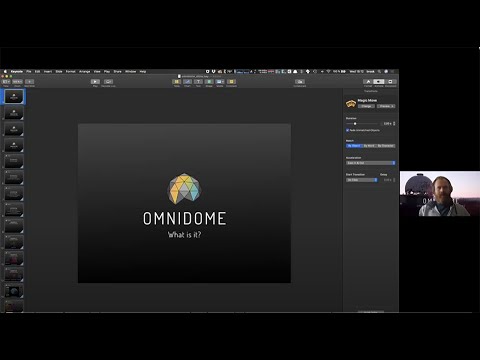
Built with Qt: Omnidome {On-demand webinar}
Watch the 'Built with Qt: Omnidome' demo showcased at SIGGRAPH 2020. You will learn: - How to map im...
Watch Video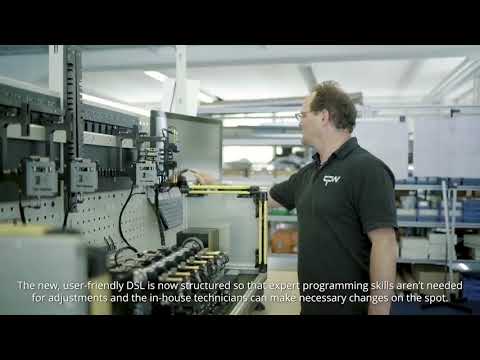
Built with Qt: OPW domain specific language overhaul with KDAB
OPW's domain-specific language (DSL) was too complex for the operating technicians. Every time a mea...
Watch Video
Built with Qt: Parker Hannifin Application Designer
Together with The Qt Company, Parker Hannifin created a software development tool called Parker Appl...
Watch Video
Managing the UX Platform Project, Parker Hannifin
Ville Nummela, Software Development Team Leader, managed a complex project including the development...
Watch Video
Built with Qt: QIS revolutionizing cancer research with KDAB
Solving cancer is probably the biggest mystery that we will see unravel in our life. Because cancer ...
Watch Video
Quantitative Imaging Systems and KDAB - Revolutionizing Cancer Research
Quantitative Imaging Systems (Qi) unravel cancer through digital imaging microscopy and machine lear...
Watch Video
Built with Qt - Secure & Connected Carputer with LinkMotion
Qt Partner Link Motion has created a Carputer based on The Qt Automotive Suite. IVI & Cluster ru...
Watch Video
Built with Qt: Symbio Elysian
Symbio - a digital services and R&D company - introduces Elysian, an infotainment solution that ...
Watch Video
Tableau, Business Intelligence & Analytics Built with Qt
You guessed it – Tableau's responsive and stunning user interfaces are “Built with Qt”. The $3.5 Bil...
Watch Video
Built with Qt - Wittenborg Coffee Machine
Qt Partner Witekio presents their company and their Wittenborg coffee machine demo.
Watch Video
C++ to QML Animations {Qt Virtual Tech Con 2020}
Fluid UI Animations are the heart and soul of all modern User Interfaces. This webinar, aimed at Qt ...
Watch Video
Certified Functional Safety with Qt Safe Renderer {On-demand webinar}
In this webinar we talk about functional safety and how the Qt Safe Renderer can be used in systems ...
Watch Video
China Mobile Partners with Qt to offer graphical user interfaces on its IoT Operating System OneOS
China Mobile Partners with Qt to offer graphical user interfaces on its IoT Operating System OneOS I...
Watch Video
Modern CMake for Qt Developers | Keynote | #QtWS21
With 55% of developers using CMake as a build tool for C++ code, CMake is the de facto standard buil...
Watch Video
Coding with Qt for the Android Automotive Platform | Platform | #QtWS21
The presentation is about how Qt can be used for IVI development on the Android Automotive platform,...
Watch Video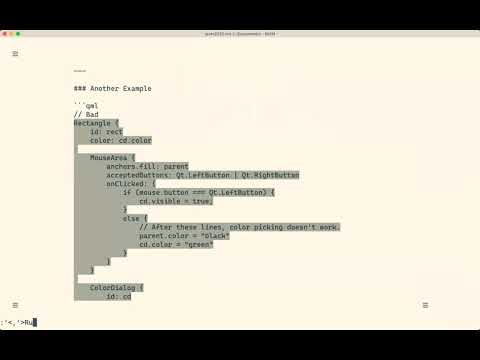
Community Driven QML Coding Guidelines - Autodesk {Qt Virtual Tech Con 2020}
The purpose of this talk is to introduce some of the guidelines that are already in place, and also ...
Watch Video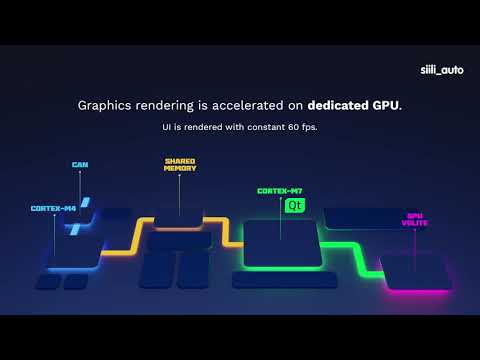
Cost-effective embedded HMI solution {demo}
Create a fully digital experience for anyone Creating embedded technology with modern UIs can take t...
Watch Video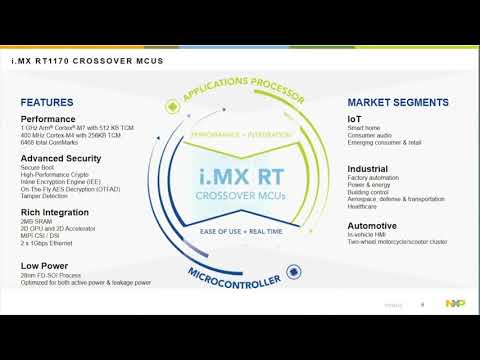
Cost-Optimized HMI & Advanced GUI's for Automotive & Transportation Applications {On-demand webinar}
Join this webinar to learn how to leverage NXP i.MX RT1170’s powerful crossover MCU family and Qt cr...
Watch Video
Python UI Builder: The Official Python Bindings for Qt
Everything you can do with C++ in Qt, you can do with Python instead! Creating UIs should be fast, f...
Watch Video
Creating Advanced GUIs for Low power MCUs with Qt
Microcontrollers, often referred to as MCUs, are used in a growing array of systems and devices, inc...
Watch Video
Creating Smart Devices with Qt on the NXP i.MX RT series
Ultimate Graphical Performance on NXP Microcontrollers with Qt for MCUs Get started with Qt for MCUs...
Watch Video
Creating User Interfaces for Microcontrollers (Qt & NXP) - Part I
Qt for MCUs is a complete graphics framework and toolkit with everything you need to design, develop...
Watch Video
Creating User Interfaces on MCUs {Qt Virtual Tech Con 2020}
Microcontrollers (MCUs) are ubiquitous in electronic appliances in consumer electronics, industrial ...
Watch Video
Cross-platform software scalability explained
Qt Business Line Director Patrick Dalez explains the different dimensions of scalability and how Qt ...
Watch Video
Customer Keynote: BSH Home Appliances GmbH | Keynote | #QtWS21
BSH Home Appliances GmbH is the leading manufacturer of household appliances in Europe with over 60,...
Watch Video
Deliver a rich graphical UX without blowing your hardware costs - DevDes 2021
www.qt.io https://www.qt.io/product/qt6 Delivering a rich HMI within a limited budget often requires...
Watch Video
Three advantages of Qt Quick 3D
Maurice talks us through a Qt Quick 3D demo shown at Embedded World 2022 that highlights three major...
Watch Video
Design and Development communication to ensure a usable graphical interface
www.qt.io https://www.qt.io/product/qt6 While collaboration during development is helpful for code a...
Watch Video
Design as a Team Sport - DevDes 2021
www.qt.io Every seasoned designer has fallen into the trap. They see the bad design in front of them...
Watch Video
Designing delightful products
Powerhouse companies like Apple and Tesla are dependent on their UX. Learn why & how an excellen...
Watch Video
Desktop Applications with Qt - Native Styling and the future
www.qt.io Join a Fireside-chat on Qt for Desktop, Qt Widgets, and Qt Quick for UIs that will rock yo...
Watch Video
DevDes 2021: Digital Products Rewrite The Requirements For Development Tools
Watch a recording of Vice President and Principal Analyst Jeffrey Hammond's related keynote from the...
Watch Video
Developing certified Medtech products with Qt {Qt Virtual Tech Con 2020}
During this session you will learn How Qt supports regulated medical product development: Best pract...
Watch Video
Developing for Accessibility
www.qt.io It’s fairly easy to build powerful visual experiences using Qt Quick and QML. But what doe...
Watch Video
Developing Modern Desktop Application in 2022 {On-demand webinar}
Desktop application development is rapidly evolving. To successfully develop modern software in 2022...
Watch Video
Developing Qt6 Projects With CMake | Tools | #QtWS21
The Qt 6.2 release brings with it a smoother, simpler and more flexible CMake experience for develop...
Watch Video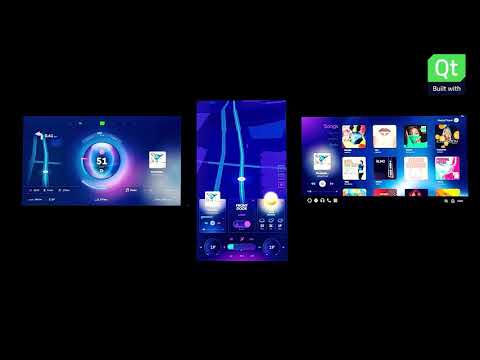
Digital Cockpit on Multiple Screens and Operating Systems
Built with Qt: Digital Cockpit on Multiple Screens and Operating Systems
Watch Video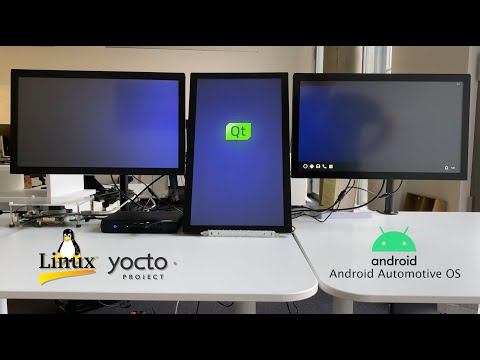
Digital Cockpit With Multi-OS Support
Three screens. Three operating systems. One exceptional user experience. #BuiltWithQt First shown at...
Watch Video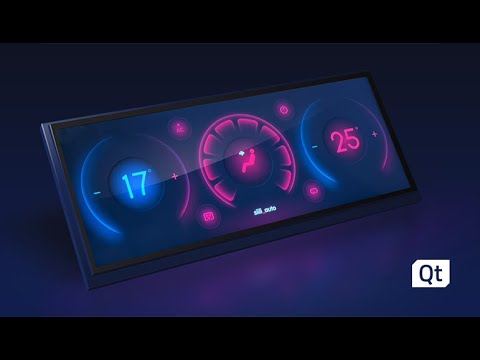
Driving Down Development Costs for Richer HMIs with Qt & NXP i MX RT1170 {On demand webinar}
Automotive HMI solutions traditionally require complicated hardware and extensive architecture to ac...
Watch Video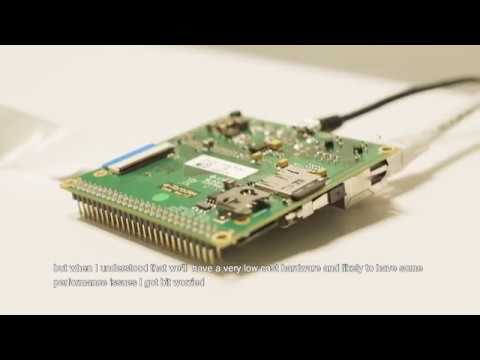
E-bike instrument cluster with low end System-on-Chip (SoC)
This is an e-bike instrument cluster concept designed and implemented in co-operation with Gofore. T...
Watch Video
Embedded Machine Learning Based Decision Support for IoT | Platform | #QtWS21
Decision support systems require accurate decision support and intuitive interfaces to be accepted b...
Watch Video
Embracing Python: From Prototypes to Hybrid Applications {Qt Virtual Tech Con 2020}
Qt for Python has been out officially more than one year, and during this period we have been gather...
Watch Video
Empower your design of HMI/UX by integrating advanced simulation capabilities - Dev/Des 2021
In this talk, you will learn how your design of HMI/UX can benefit from early system-level simulatio...
Watch Video
Enabling Next-Generation Drug Discovery
www.qt.io Pat Lorton, CTO at SchrĂśdinger, talks about the field of computational chemistry, and how...
Watch Video
Enhancing Your UX to Engineering Workflow, ICS - DEVDES, 2021
Qt Design Studio promises to improve the User Experience (UX) to Engineering workflow by providing a...
Watch Video
Ensuring GUIs Minimal Footprint & Maximal Performance in MCU Applications | User Interface | #QtWS21
Graphical user interfaces (GUIs) are increasingly present in MCU applications. Typical GUI implement...
Watch Video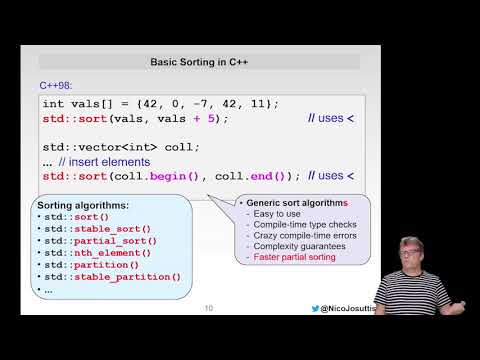
Even More Modern C++
Nicolai M. Josuttis Author of several C++ books, trainer, and member of the C++ standards committee ...
Watch Video
Ford builds a virtual automotive feature simulator with Qt!
Ford has been using Qt to take the testing of new features inside their cars into the virtual space....
Watch Video
Ford Motor Company Vehicle HMI - Building With Qt From the Very First Step
Ford's engineering teams use Qt right from the beginning of the vehicle HMI development process. Hig...
Watch Video
Forrester study: Digital Products Rewrite The Requirements For Development Tools - dev/des 2021
https://www.qt.io/product/qt6 www.qt.io Digital products can improve customer experience, automate d...
Watch Video
Foundation For the Future - Are we excited? {Qt Virtual Tech Con 2020}
Lars has been working on Qt for 20 years starting as a software engineer to later leading the global...
Watch Video
Fresenius develops dialysis machines with Qt
Fresenius' dialysis machines are used all across the world to treat kidney diseases. Qt helps them c...
Watch Video
Get Started creating dynamic UIs with Qt Design Studio and Photoshop on MCUs {On-demand webinar}
Watch the step-by-step walkthrough demo showcased at SIGGRAPH 2020 on Creating dynamic UIs with Qt D...
Watch Video
Getting Started with QDS - Using the Qt Quick 3D Components
Get started with using Qt Design Studio. This video focuses on how to import and use the Qt Quick 3D...
Watch Video
Getting Started with QDS - Using the Qt Quick 3D Custom Shader Utilities, Materials, and Effects
Get started with using Qt Design Studio. This video introduces the Qt Quick 3D Custom Shader Utiliti...
Watch Video
Getting Started with Qt for Android {Qt Virtual Tech Con 2020}
In this webinar, we'll go through the steps for setting up the environment to work with Qt for Andro...
Watch Video
Getting started with Qt for MCUs 1.0 {on-demand webinar}
The recent launch of Qt for MCUs 1.0 – the new Qt Quick Ultralite rendering engine, running on bare ...
Watch Video
Getting Started with Yocto & eLinux on Qt for Device Creation {Qt Virtual Tech Con 2020}
This is hands-on session will get you started with setting up and configuring Qt Creator on four dif...
Watch Video
Girbau customer-focused design | Keynote | #QtWS21
Customer Experience in industrial and commercial environments is sometimes forsaken, but it makes th...
Watch Video
Globus Medical: Imaging, Navigation, and Robotics with Qt | Graphics | #QtWS21
Computer-assisted surgeries are changing the nature of today’s operating room (OR). The technology i...
Watch Video
Gofore Experiences the Qt-Enhanced UI Development Workflow
From Design to Deployment: Listen to Gofore's telling of how they prototyped for production with bla...
Watch Video
Graphics on STM32: tools for embedded GUI design and development {On-demand webinar}
Implementing a Graphical User Interface (GUI) for embedded devices is often more challenging than de...
Watch Video
Harman Built 3D HMI System with Qt
Harman Built 3D HMI System with Qt Interview @ Qt World Summit 2021 China - Shanghai Meetup
Watch Video
Hexagon's Product Line AICON builds 3D measuring systems with Qt
Try Qt now: https://www.qt.io/download Hexagon's Product Line AICON has developed, manufactured and ...
Watch Video
How are Companies Overcoming the Global Chip Shortage {On-demand webinar}
61 % of decision makers agree that the current semiconductor shortage has negatively impacted their ...
Watch Video
How designers and developers collaborate for Automotive HMI
Ciro discusses the steps required to take an automotive HMI from the first initial concepts all the ...
Watch Video
How Mbition is modularizing the MBUX system for faster upgrades and greater resilience
In this keynote interview, Kai Uwe Broulik, Expert Software Engineer, Infotainment at MBition, the M...
Watch Video
How NVIDIA Nsight Graphics Utilizes Qt to Create Powerful Tools for 3D Graphics | Graphics | #QtWS21
The ARM architecture is the most pervasive processor architecture in the world, so having the abilit...
Watch Video
How Qt is equipping the industry with tools for the software-defined vehicle
The three key trends – electrification, automation, and connectivity – are reshaping customer expect...
Watch Video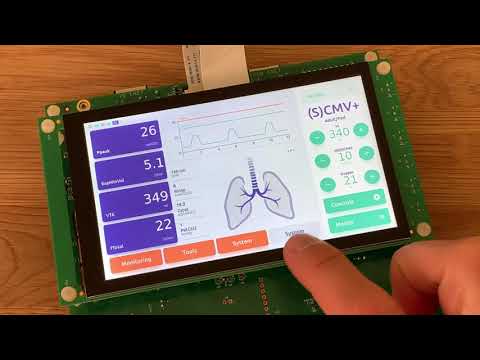
How to Create a Ventilator UI for MCUs overnight {Showcase}
Watch the full webinar for free:https://resources.qt.io/qt-mcus/how-to-create-a-medical-device-proof...
Watch Video
How to foster collaboration between designers and developers - Roundtable at Embedded World 2021
Break the cycle of painstaking feedback loops between designers and developers. Use unified design a...
Watch Video
How to improve the UX of an industrial robot with Qt - DevDes 2021
www.qt.io Programming a robot arm is a challenge since there are a lot of menus and submenus, no int...
Watch Video
How to painlessly migrate from MFC to Qt
Microsoft Foundation Class Library (MFC) is a legacy C++ object-oriented library on Windows that exi...
Watch Video
How to Turn Your Design Visions into Functional Products {On-demand webinar}
When creating a working UI, there is often a disconnect between the designer’s vision and what devel...
Watch Video
How your Python projects can benefit from Qt? {On-demand webinar}
- How Qt plays in the Python world & the latest and greatest from Qt 6.3: Discover the insights ...
Watch Video
HTML5 vs Qt {showcase}
One man, three weeks to create an application using HTML5 and three weeks using Qt. The result speak...
Watch Video
Hybrid Qt Development: Boosting Your Projects with Python | Platform | #QtWS21
Qt has been under development for many years, and it has been evolving with the community and the de...
Watch Video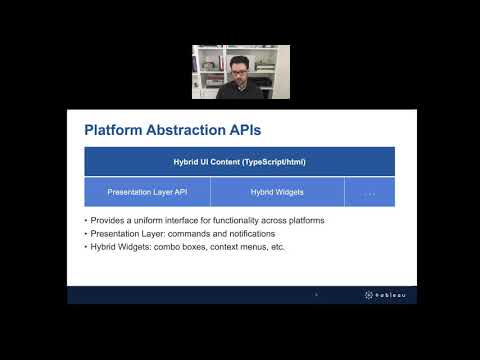
Hybrid UI in Tableau Desktop
www.qt.io Tableau Desktop uses communication between web UI and native code to build new features an...
Watch Video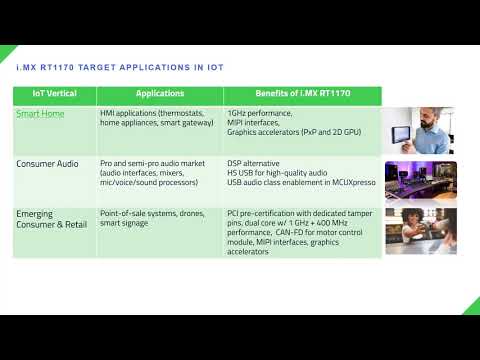
i.MX RT1170 Crossover MCUs - Ushering in the GHz Era of MCUs
Join this session for an overview of the 1GHZ i.MX RT1170 MCU family to support your consumer, indus...
Watch Video
Improve Time to Market for Industrial Edge Devices {On-demand webinar}
Qt and WINSYSTEMS have collaborated to provide an out of box experience on industrial-grade embedded...
Watch Video
In-Depth Model/View with QML - ICS {Qt Virtual Tech Con 2020}
The model/view design pattern is the standard way of separating UI from business logic, especially w...
Watch Video
Interview with Jim Tieman (Neocis) | Keynote | #QtWS21
Neocis is developing a dental surgery robot and is utilizing Qt to build the key functionalities on ...
Watch Video
Introducing Qt 3D Studio
NVIDIA made one of the largest contributions ever to Qt. They contributed the entire NVIDIA DRIVE™ D...
Watch Video
Introducing Qt 5.9 - Release video
High performance & stable new features. It’s even long term supported. From 5.7 and onwards Qt i...
Watch Video
Introducing Qt for MCUs. Ultimate performance. Tiny footprint.
More about Qt for MCUs here: https://www.qt.io/qt-for-mcus Qt for MCUs 1.0 is finally available for ...
Watch Video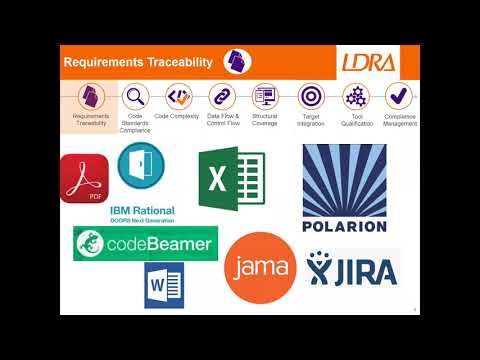
Introduction to Functional Safety & Security, LDRA, {Qt Virtual Tech Con 2020}
There is increasing demand for QT based GUI driven applications in the safety critical sectors, wher...
Watch Video
Introduction to Qt Creator IDE {Qt Virtual Tech Con 2020}
Qt Creator is a powerful IDE aimed at making you a more productive C++ and Qt programmer. This webin...
Watch Video
IoT Revolution: Introducing connected coffee machines built with Qt {On-demand webinar}
Most of our consumer appliances and for example coffee machines are being connected online. IoT allo...
Watch Video
IoT Today and Tomorrow - Qt Demo
Qt Internet of Things Sensor Demo built with Texas Instruments Sensortag.
Watch Video
Kickstart your Qt Project on NXP i.MX 8 Series Application Processors {On-demand webinar}
The latest NXP i.MX 8 Series of applications processors provide a very reliable computing platform w...
Watch Video
Level up your Business Intelligence for the next generation coffee machine
As the number of connected devices is projected to reach 75.44 billion worldwide by 2025, consumer p...
Watch Video
LG Electronics use Qt to power their evolving webOS platform
LG Electronics is expanding their 'built-with-Qt', webOS platform into the automotive space with web...
Watch Video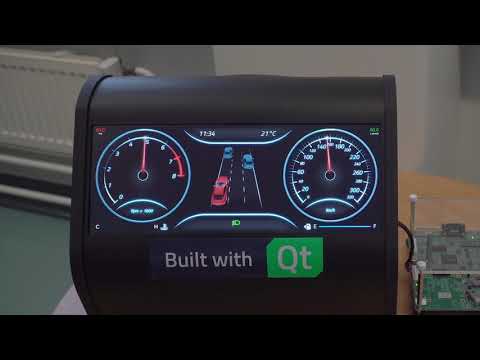
Low-End Digital Automotive Instrument Cluster {showcase}
In volume products, it's all about reducing the bill of materials (BOM) cost and squeezing the juice...
Watch Video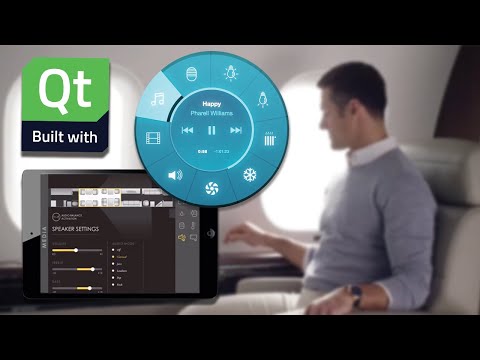
Lufthansa Technik takes Qt into the skies - Built with Qt and KDAB
For VIP and business aircrafts, »nice« is the industry standard in cabin management and in-flight en...
Watch Video
Machine Learning meets Embedded Development {On-demand webinar}
Qt and Ekkono are working together to improve machine learning integration in the embedded developme...
Watch Video
Making music: Architecting realtime audio development with QML - DevDes 2021
www.qt.io At Vochlea, they have built vocal-controlled music-making software that employs real-time ...
Watch Video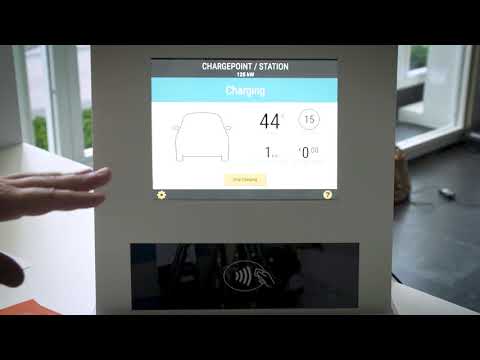


Medical demo created with Qt Design Studio running Qt Safe Renderer on Integrity RTOS {showcase}
Roger Mazzella from The Qt Company shows off our latest infusion pump demo. It was created with Qt D...
Watch Video
Meet Qt 6.2 LTS - Ask us anything! {On-demand webinar}
With such an epic release as Qt 6.2 LTS – the first long-term supported version of Qt 6 – , we are r...
Watch Video
Meet Qt 6 - DevDes2021
Join Qt speakers as we introduce Qt 6, the latest version of Qt, and the cross-platform software dev...
Watch Video
Meet Qt 6 {On-demand webinar}
Join Lars Knoll and Tuukka Turunen to learn about the all-new Qt 6 with Q&As. Qt 6 offers you Th...
Watch Video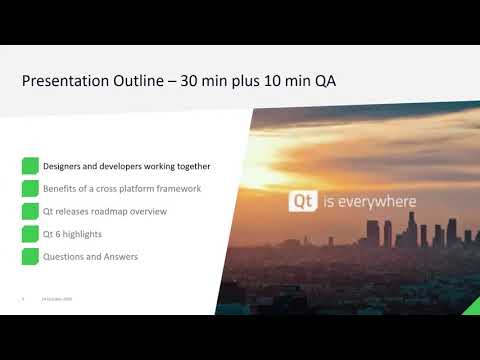
Meet Qt Nordics Online 2020
Join us in a complimentary online Meet Qt Nordics seminar with live Q&A to learn how to create b...
Watch Video
Meet Qt Spain Online
Watch online Meet Qt Spain seminar with Q&A to learn how to create better connected devices, UIs...
Watch Video
Migrate to Qt 6.2: Solid performance. Stability. Long-term Support | Platform | #QtWS21
Qt 6.2 is the first long-term supported (LTS) version in the Qt 6 series and is thus the next go-to ...
Watch Video
Minimizing Risks When Building an Instrument Cluster HMI {On-demand webinar}
" Realizing your UX vision for an instrument cluster is often not straight forward and easy. Since d...
Watch Video
Modern Application Development for Any Domain {On-demand webinar}
With the rise of the high-resolution, responsive mobile user interface has come rising user expectat...
Watch Video
Modern microcontroller (MCU) application development with Qt {On-demand webinar}
Qt for MCUs is a complete graphics framework and toolkit with everything you need to design, develop...
Watch Video
Modern Qt Development with Software Containers for Devices
www.qt.io Software Containerization is all the rage. Toradex' Stefan Eichenberger talks about the ad...
Watch Video
Moving to Vulkan in Qt for Automotive - Pros & Cons, Siili {Qt Virtual Tech Con 2020}
Join Filip in a live webinar on Vulkan with Qt in the Automotive context. The talk will cover follow...
Watch Video
Multimodal User Interfaces on iMX RT Crossover MCUs, NXP - DEVDES 2021
Embedded user interfaces (UI) increasingly combine aspects of graphics, audio, and voice into one co...
Watch Video
Next Generation Industrial UIUX in a Post Pandemic World - DevDes2021
www.qt.io The adoption of capacitive touch sensing technology is expanding rapidly. The spread of CO...
Watch Video
Next-Generation Smart Home Designs with High-Performance Qt for MCUs | User Interface | #QtWS21
Next-generation smart home devices are increasingly interactive, intelligent, and personalized. Join...
Watch Video
Next Level User Experience for Medical Devices {On-demand webinar}
Medical industry is in a need of modernizing a lot of products while also bearing in mind the safety...
Watch Video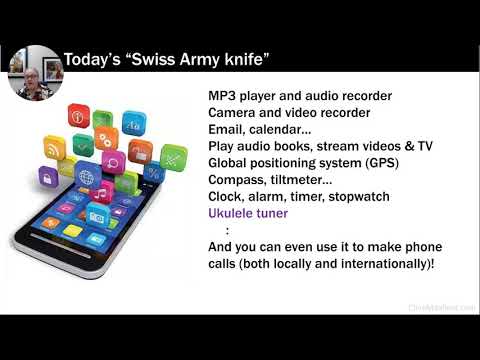
Not your Grandmother's Embedded Systems
www.qt.io In his talk, Clive ‘Max’ Maxfield will cover the past and future of embedded development, ...
Watch Video

{On-demand webinar} WebAssembly: The Next-Generation Web Platform
WebAssembly is a bytecode representation that is meant to be targeted by high-level programming lang...
Watch Video
One framework to rule them all - Introducing Qt 5.8
Qt just got even more awesome -- We are always working on improving Qt to ensure it continues to be ...
Watch Video
One team, One dream - Seamless User Experience Design for Multiple Device Families
Emmanuel Penzes, Pre-sales Engineer, The Qt Company, shows you how to deploy the same software to mu...
Watch Video
Scaling Digital Cockpit Development
The in-vehicle digital experience often falls short of user expectations, with drivers choosing inst...
Watch Video
Oven UI/UX Design with the Qt toolchain - Dev/Des 2021
www.qt.io https://www.qt.io/product/qt6 The complexity and level of graphical details for home appli...
Watch Video
PDF rendering in Qt Quick {Qt Virtual Tech Con 2020}
Qt has recently added a more full-featured wrapper around PDFium, the same implementation that Chrom...
Watch Video
Set Yourself up for Success - Lessons Learned from Building 100+ Devices with C++/Qt/QML
These days everything depends on software, and that software is growing more and more complex. It’s ...
Watch Video
Product differentiation through your ebike HMI
As major cities move to adopt to a new post-pandemic reality, electric Bikes are going to leap forwa...
Watch Video
Training: Programming for Microcontrollers (STMicroelectronics)
Qt for MCUs is a complete graphics framework and toolkit with everything you need to design, develop...
Watch Video
Programming Smart devices with Qt for STM32 family {On-demand webinar}
Ultimate Performance. Tiny Footprint. Create Graphical Applications with on STM32 Cortex M7 processo...
Watch Video
Prototyping for Production: Watch your designs come alive on your device {showcase}
This is a teaser of what we are currently working on with our designer offering. Visit our web page ...
Watch Video
Python and C++ interoperability with Shiboken {On-demand webinar}
C++ and Python are two fantastic programming languages that bring to the table a considerable amount...
Watch Video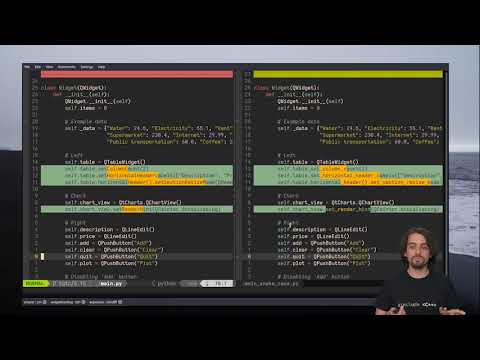
Python and C++: the best of both worlds
www.qt.io Dr. CristiĂ n Maureira-Fredes, R&D Manager at The Qt Company of PySide fame dives into...
Watch Video
QML/C++ Architecture Best Practices & QML Tips for Efficient Development - Dev/Des 2021
This talk targets all engineers who want to improve their QML knowledge. In this talk, you learn: * ...
Watch Video
QML for building beautiful desktop apps - Dev/Des 2021
QML is already among the best tools for building beautiful applications for touch screen devices. Bu...
Watch Video
Qt 3D Studio Home Automation Demo
Watch how you can create graphical elements in your favorite design tool, import them in Qt and use ...
Watch Video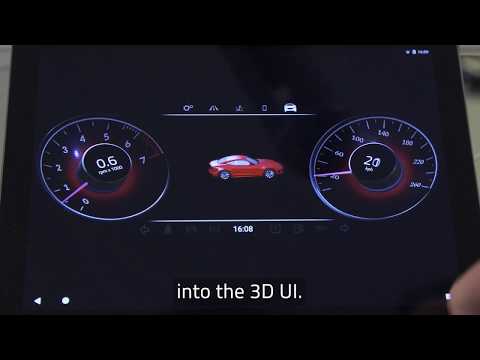
Qt 3D Studio release introduction
Watch the highlights of the Qt 3D Studio, a world class 3D User Interface design tool that supports ...
Watch Video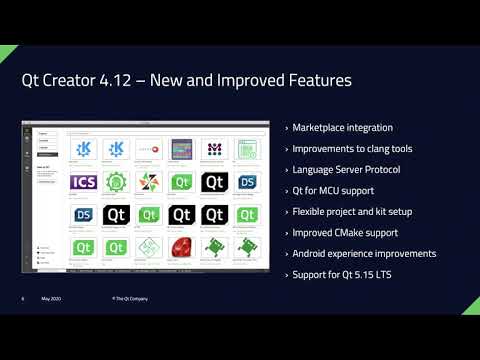
Qt 5.15 LTS: Built to Last
Qt 5.15 LTS will be the last momentous release before the great transition into Qt 6. We have gone t...
Watch Video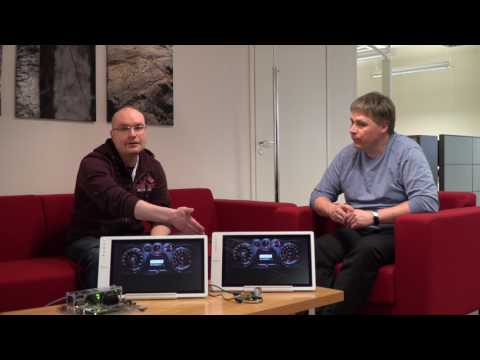
Qt 5.9 on INTEGRITY RTOS
The Green Hills INTEGRITY Real-Time Operating System (RTOS) is widely used in safety- and security-c...
Watch Video
Qt 6.2 and beyond | Keynote | #QtWS21
On the keynote presentation, the Qt Company's CEO Juha Varelius, Chief Architect Lars Knoll, and VP ...
Watch Video
Qt 6.2 LTS vs. Qt 5.15: The big feature parity comparison {On-demand webinar}
We have built Qt 6 as the Productivity Platform for the Future to empower Next-Generation 3D/2D User...
Watch Video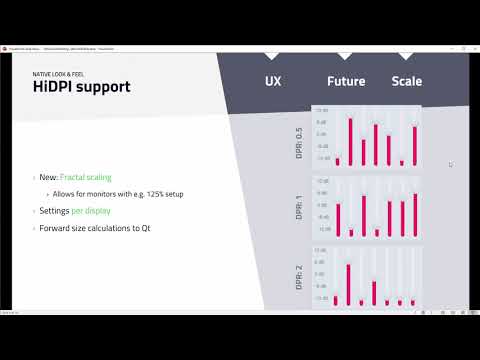
Qt 6 on the desktop. Ready for the next decade
www.qt.io Qt has been evolving for more than 25 years now and with Qt 6 took the next major step. Fl...
Watch Video
Qt and OpenAPI/Swagger - a tutorial - Dev/Des 2021
OpenAPI (aka. Swagger) is a widely used technology to implement APIs in a cloud/IT context. It provi...
Watch Video
Qt and Software Containers for Embedded Devices
www.qt.io Software Containerization is where it’s at! Would you agree? Learn about the advantages an...
Watch Video
Qt at ARM TechCon by Toradex - Built with Qt
1. Self-Balancing TAQ Robot runs two separate operating systems with the same hardware and use them ...
Watch Video
Qt brings Ulstein's daring & industry disruptive vision to reality
The first project with Qt and The Qt Company services team, has enabled Ulstein Power & Control ...
Watch Video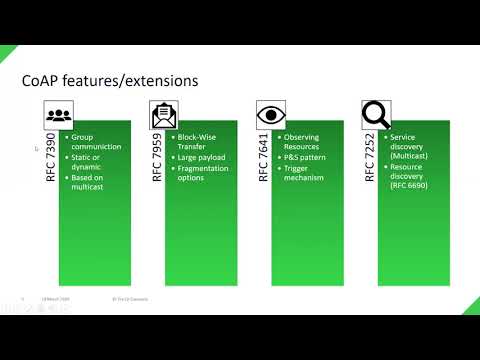
Qt CoAP - leveraging C++ and Qt for cross-platform IoT apps {On-demand webinar}
Introducing Qt CoAP - leveraging C++ and Qt for cross-platform IoT apps CoAP is a specialized web tr...
Watch Video
Qt Core UI, Live Forum {On demand webinar}
Let's talk Qt Application Architecture! Creating a user experience that is simple for the user, spec...
Watch Video
Qt Creator in Space | Tools | #QtWS21
In this talk, you will learn good practices in creating Qt Creator plugins and hear experiences on h...
Watch Video
Qt Debugging & Profiling
Qt Debugging & Profiling – The developer experience with productivity at its core. From developm...
Watch Video
Qt demo: Cross-platform smart oven app
Qt Senior Pre-Sales Engineer Stefan Jost walks you through the home appliance demo, which showcases ...
Watch Video
Qt Design Studio for Great Designs and Collaboration
Working relationships between designers and developers can be complicated. It's as if they speak dif...
Watch Video
Qt Design Studio & Software Development Integration {On-demand webinar}
When creating a working UI (user interface), there is often a disconnect between the Designer’s UI d...
Watch Video
Qt design workflow explained
Qt Technical Artist Arnaud Armengaud explains step-by-step how designers can create production-ready...
Watch Video
Qt for MCUs Deep Dive {Qt Virtual Tech Con 2020}
Qt for MCUs is a new offering where we combine Qt’s delightful declarative approach to user interfac...
Watch Video
Qt for MCUs Demo: Fitness Console (Treadmill)
Check out this treadmill console demo, with animated backgrounds and smooth animations, 'running' on...
Watch Video
Qt for MCUs: Hybrid Instrument Cluster on a Renesas RH850-D1M1A Microcontroller {showcase}
Qt for MCUs 1.1 offers a complete graphics framework and toolkit with everything you need to design,...
Watch Video
Qt for MCUs - Installation Guide
Join Qt's Devinder Sodhi as he guides you step by step through the installation process for Qt for M...
Watch Video
Qt for MCUs | Low-Cost Advanced HMI & GUIs on Infineon Traveo II {Showcase}
Qt and the new Infineon's HMI Tool Certification Program help users build rich, scalable, and next-g...
Watch Video
Qt for MCUs: Motorcycle Instrument Cluster on a NXP i.MX RT1170 EVK microcontroller {showcase}
Qt for MCUs 1.1 offers a complete graphics framework and toolkit with everything you need to design,...
Watch Video
Qt for MCUs: Motorcycle Instrument Cluster on Renesas RH850 microcontroller {showcase}
Qt for MCUs 1.1 offers a complete graphics framework and toolkit with everything you need to design,...
Watch Video
Qt for MCUs - Wearable smartwatch demo by Siili Auto - NXP Microcontroller
A smartwatch demo showing a fitness wearable UI with a full feature set from clock, to monitoring wo...
Watch Video
Qt for Python: Introduction to the Shiboken Wizard
Starting from 6.1, commercial users will be able to use the Technical Preview of the new tool: Shibo...
Watch Video
Qt for Python: Repository overview
Would you like to discover what is inside the main repository of the project? Are you curious to kno...
Watch Video
Qt for Python: Resources overview
Do you know the wiki, website, and repository locations? if it feels like too many resources, this v...
Watch Video
Qt for WebAssembly {showcase}
Qt for WebAssembly lets you build Qt applications for web browsers. Code once, deploy everywhere - e...
Watch Video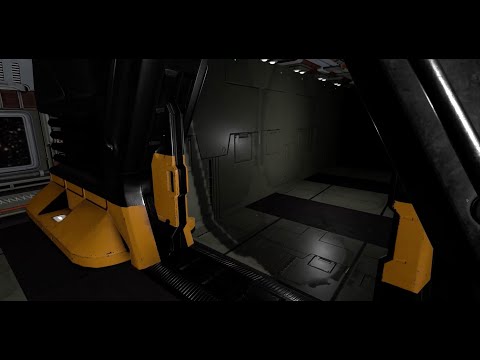
Qt Hackathon Compilation
Check out what impressive feats of graphic performance our talented devs cobbled together in just tw...
Watch Video
ICS builds Alexa Voice-Controlled Systems with Qt
ICS VP of Engineering Roland Krause talks voice-controlled infotainment systems and how he used Qt t...
Watch Video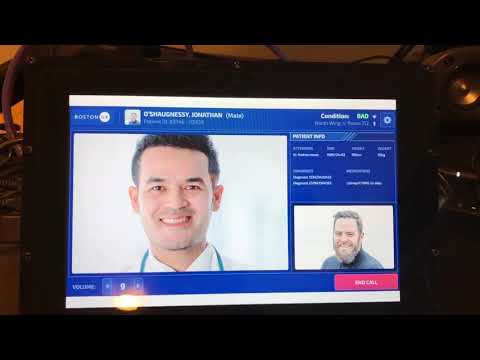
Qt Installer Framework with Qt 6 | Tools | #QtWS21
In this talk we will explore functions that assist developers in both packaging and deploying their ...
Watch Video
Qt is everywhere! Watch the video!
Qt is everywhere! Explore all the expected and unexpected places where Qt touches our lives!
Watch Video
The World's Fastest Electric Supercar, Qt IVI & Cluster in Rimac's Concept One
The World's Fastest Electric Supercar deserves The World's Fastest Software and that's why they chos...
Watch Video
Qt Configuration Tool - Reduce Your Footprint & Optimize Performance
Qt for any platform, any thing, any size Reduce your footprint by up to 60% and optimize performance...
Watch Video
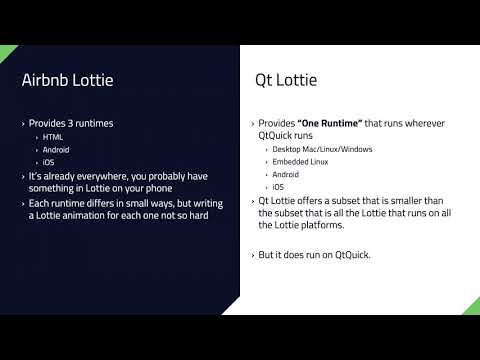
Qt Lottie: Embedding Adobe After Effects right in your application
Thanks to the Qt Lottie library, UX designers can now embed their designs into applications directly...
Watch Video
Qt for MCUs - Thermostat demo on STM32F769I-Disco
Qt for MCUs. Ultimate performance. Tiny footprint. Create fluid UIs with a low memory footprint on m...
Watch Video
Message Queuing Telemetry Transport, Qt MQTT Demo
Publisher-subscriber protocols have become more and more attractive to automation infrastructures. M...
Watch Video
Qt MQTT IoT connectivity for different OS and HW {showcase}
In this video, Maurice shows how Qt MQTT enables IoT connectivity on different operating systems and...
Watch Video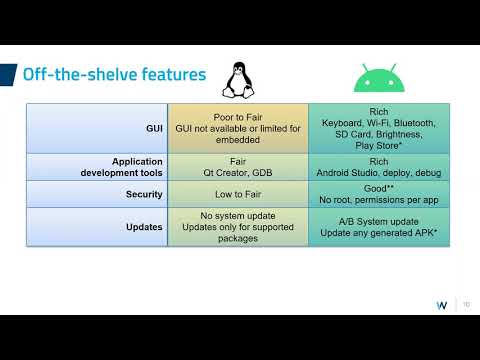
Qt or Android: Let's compare!, Witekio {Qt Virtual Tech Con 2020}
Android and Linux-Qt are both a popular choice to develop graphical UIs on embedded devices. But hav...
Watch Video
Welcome to Outrun - Teaser
Welcome to Outrun - an automotive demo built by Qt If you want to know more about this project, plea...
Watch Video
Qt Partner basysKom's OEM Custom Configurator #BuiltwithQt
Live Embedded World demo with Qt running on Windows and Embedded Linux using Qt Charts, Sensors and ...
Watch Video
Qt Productivity Tips - Highlights from Qt Widgets and More | Tools | #QtWS21
For more than a year Jesper Pedersen has hosted a Youtube series focusing on Qt Widgets and everythi...
Watch Video
Qt Professional Services
Our teams are specialized to advise, design, support and implement your solutions. We build Proofs o...
Watch Video
Qt Quick 3D Benchmark Demo
A clip from the brand-new benchmark application for Qt Quick 3D.
Watch Video
Qt Quick 3D Introduction & Best Practices {Qt Virtual Tech Con 2020}
Qt Quick now makes it easier than ever to incorporate 3D content into your application or HMI via th...
Watch Video
Qt Quick 3D Particles, Mesh Morphing and Instancing Using Qt Design Studio | Graphics | #QtWS21
Join Jarko to discover how you can add advanced 3D features directly from Qt Design Studio. Continui...
Watch Video
Branding All of Your Controls with Qt Quick Controls Imagine Style
From Qt 5.10, Qt Quick Designer allows you to style or skin the UI Forms (ui.qml files) of the Qt Qu...
Watch Video
Qt Quick Software Renderer on i.MX6 ULL by KDAB {showcase}
KDAB's Kevin Funk demos how Qt applications run on low-end hardware with fluid 60fps without GPU acc...
Watch Video
Qt Quick WebGL demo: camera remote control
Qt Quick WebGL demo. Qt-based application running on Raspberry Pi, controlling the camera’s pan and ...
Watch Video
Functional Safety, Safeguarding Users with Qt Safe Renderer
With Qt Safe Renderer you are able to separate the functional safety critical parts of your software...
Watch Video
Qt Safe Renderer and Top 5 Questions, Live Forum {On-demand webinar}
Get in the know! Learn more about Qt Safe Renderer; where does the Qt Safe Renderer fit in, and what...
Watch Video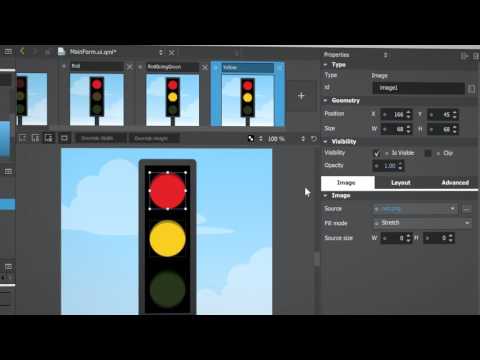
Qt SCXML and state machine tooling in Qt Creator
This video demonstrates the usage of the Qt SCXML module and how Qt Creator supports us when using t...
Watch Video
Qt Showcase KNX Automated Home {Showcase}
Maurice Kalinowski shows a complete building automation demo based on Qt and KNX. Check out more coo...
Watch Video
Qt Showcase MTA Multidisplay
MTA offers a complete “In-Vehicle” system with fast dynamics, very high-performance processors, and ...
Watch Video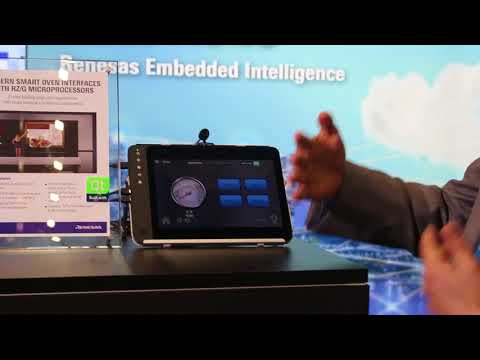
Qt Smart Oven with Renesas RZ/G Linux Platform {showcase}
Create leading edge user experiences with smart hardware/software collaboration. Key Features: - Emb...
Watch Video
Autodesk Builds Infrastructure Design with Qt
Christine Lehmann and Sebastian Voigt, developers for Autodesk Infraworks, talk about their experien...
Watch Video
CEWE's Photoworld Builds Lasting Memories with Qt
If your German's a bit rusty, you can enable English subtitles. Software developer Daniel MĂźller ta...
Watch Video
Mercedes-Benz' MBUX is Built with Qt
Head of UI/UX development at Mbition, Mykhaylo Chayka, talks about the user experience behind Merced...
Watch Video
Omron Builds Machines to make better people -- Built with Qt
The HMIs in Omron's machine are designed to help people be better at their job. Michel Min talks abo...
Watch Video
LG: Building webOS with Qt
LG's webOS, made famous with their wonderful smart TVs, has become a staple in modern consumer elect...
Watch Video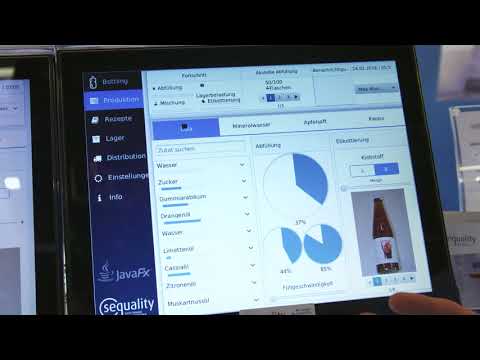
Qt vs. JavaFX by Sequality {Showcase}
Stefan Larndorfer with Sequality conducts a head-to-head comparison of the same application running ...
Watch Video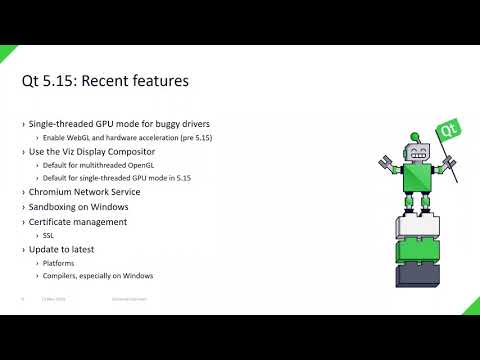
Qt WebEngine {Qt Virtual Tech Con 2020}
The chromium-based web rendering solution has been helping many products to succeed when there was a...
Watch Video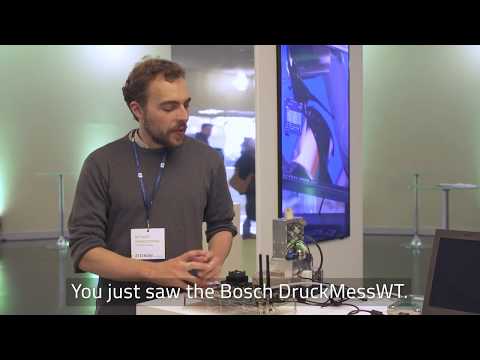
Qt WebGL Streaming Demo
Our Qt Advisor Michael Winkelmann shows a WebGL streaming demo developed for the project DruckMessWT...
Watch Video

Yuneec Unleashes the Drones with Qt
Global Software Director Paul Chen talks about how Yuneec stays lean and maintains its code base wit...
Watch Video
Qt6 and other cool new stuff - What's cooking? (part 2)
www.qt.io This is part 2 of Lars Knoll's Qt World Summit Online keynote on all the great and new in ...
Watch Video
Qt6 and other cool new stuff - What's coooking? (part 1)
www.qt.io Join Lars Knoll on a life-changing journey of discovery through the all-new Qt 6. Lars tal...
Watch Video
QtKNX Demo with Andrew O'Doherty
This demo shows implementation of M2M protocol standard in building automation application, interact...
Watch Video
Qt's super-safe medical device demo
Qt Pre-sales manager Amit Nainawat showcases a medical device demo at Embedded World 2022. The demo ...
Watch Video
QtWebGL Demo - Remote control and streaming
With an increasing number of connected devices arising, grows a need for domain-specialized services...
Watch Video
Quby builds energy-saving smart thermostats with Qt
A thermostat that helps you save energy? Quby's Toon does just that. And just as this little rascal ...
Watch Video
Building Qt for Any Embedded Technology
Rami Potinkara, Sr. Manager in Qt R&D will talk about a cookbook and practical tools to boot dev...
Watch Video
Rapid UX prototyping to test and communicate UX {On-demand webinar}
Adopting methods for rapid UX prototyping and including developers in iterative user testing ensures...
Watch Video
Built with Qt - Raytheon AnschĂźtz loves QML - with Jakob Gaude
Jakob Gaude with Raytheon AnschĂźtz explains how they could speed up development and prototyping wit...
Watch Video
Real-time 3D made easy with Qt Design Studio and Qt Quick 3D
Imbue your designs with HDR lighting, physically-based PBR materials, custom animations/transitions,...
Watch Video
Roadmap to the Future of Qt {On-demand webinar}
What lies ahead and how are we building the cross-platform tool of the future for you? How are the k...
Watch Video
Rust binding for Qt : How to mix QML with Rust
Rust is a modern system programming language that emphases on performance reliability and productivi...
Watch Video
Saab Technologies uses Qt for aerial and marine traffic management
Want to try Qt yourself? Head over here: https://www.qt.io/download Saab Technologies tracks the tra...
Watch Video
Shaders and Materials for 2D/3D Contents in Qt 6 | Graphics | #QtWS21
Qt 6 introduces a new layer for managing 3D APIs, such as, Vulkan, Metal, Direct 3D, and OpenGL, tog...
Watch Video
Siili Solutions design and develop faster with Qt, Built with Qt Keynote @QtWS18
For additional customer story videos and other content, take a look at our resource center: https://...
Watch Video
SilhouetteFX: Award-Winning Visual Effects Software - Built with Qt
SilhouetteFX is a 2 x Academy Award Winning rotoscoping and paint visual effects software built with...
Watch Video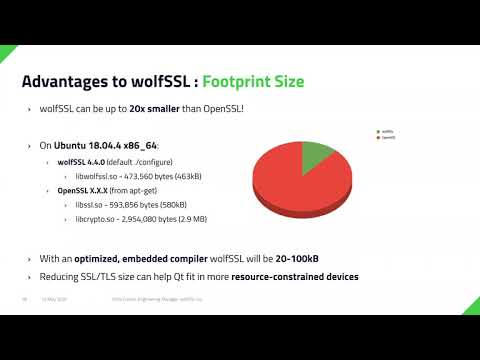
SSL/TLS in Qt: Introduction to wolfSSL - wolfSSL {Qt Virtual Tech Con 2020}
Qt has traditionally used OpenSSL as the provider for SSL/TLS in Qt Network for secure network commu...
Watch Video
STM32 Accelerating the HMI of Things with Qt & TouchGFX {On-demand webinar}
Devices featuring connected and smartphone-like user experiences are quickly becoming an industry st...
Watch Video
Stunning Wearable Design & MCU Development Trends {On-demand webinar}
Wearable technology are electronic devices that are most popular worn as accessories; however, other...
Watch Video
Styling a Qt Quick Controls Desktop Application | User Interface | #QtWS21
Qt Quick Controls comes with a powerful styling API that lets you polish your application to make it...
Watch Video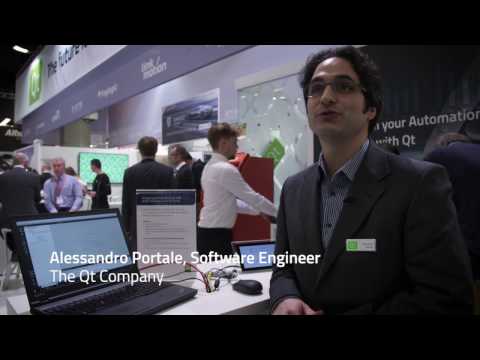
Styling Qt Quick Controls 2 with Photoshop
We are researching a new approach on how to style Qt Quick Controls 2 from Photoshop or other design...
Watch Video
Using less code to do more things with Qt, System SPA, Federico Di Mattia
Multiplatform capabilities, powerful libraries and more time to do more things are some of the reaso...
Watch Video
The best chance at success for your embedded products - DevDes 2021
Although the title is a reference from soccer, embedded design is another area where it’s extremely ...
Watch Video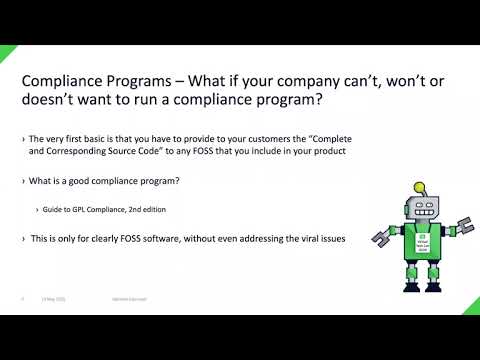
The Evolution of the LGPL License Agreement -- A Review of the LGPL v3 {Qt Virtual Tech Con 2020}
In this webinar, attendees will learn how to comply with the requirements of the GPL/LGPL v3 License...
Watch Video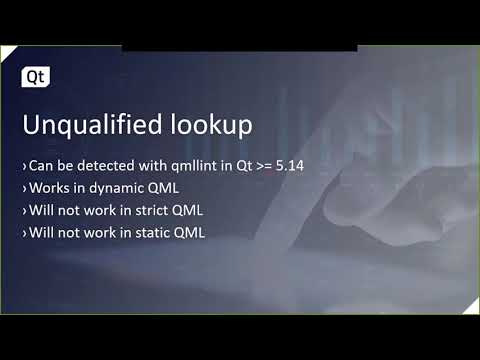
The Future of QML {Qt Virtual Tech Con 2020}
The QML language and engine will face major new challenges and developments in Qt 6. In order to sca...
Watch Video
The New Property Bindings: Making C++ more QMLish | Platform | #QtWS21
With the introduction of QML, it was possible to do reactive programming in Qt by creating bindings....
Watch Video
The new Qt Multimedia in Qt 6.2
The multimedia support in Qt has seen some larger changes between 5.15 and 6.2. Those were triggered...
Watch Video
The Possibility of Where
www.qt.io 'See What Others Can't' through Esri's powerful geographic information system (GIS) and th...
Watch Video
The QmlBook - Learning by Reading | User Interface | #QtWS21
The QmlBook is an online resource for learning Qt and QML. It focuses heavily on the QML side of thi...
Watch Video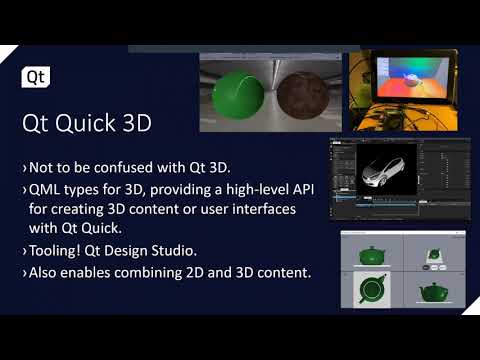
The State and Future Directions of the Qt Graphics Stack {On-demand webinar}
The way Qt handles accelerated 2D and 3D graphics is facing its biggest changes since Qt 5.0. Relyin...
Watch Video
Toradex Barcode Scanner Built with Qt {Showcase}
This 1D or 2D barcode scanner runs on on Android with Qt. It's like shopping for fruit with a Star T...
Watch Video
Total War Editors & Qt | Keynote | #QtWS21
Total War is a multi-award-winning AAA games franchise, developed by Creative Assembly, powered by a...
Watch Video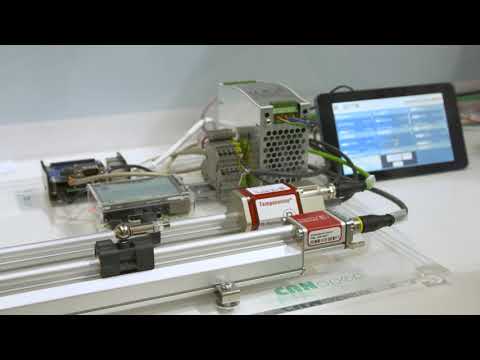
Transport & Logistics Qt application using Blockchain and MQTT {Showcase}
This demo shows how MQTT enables communication throughout the supply chain. The Qt UI enables a live...
Watch Video
Tunneled 4K HDR video support for Qt/QML on Android | Keynote | #QtWS21
Currently, Qt Multimedia renders video to a SurfaceTexture which requires the Android framework to a...
Watch Video
Turning the automotive HMI trends into reality - Industry Round-table
In this industry round-table our expert panelists discuss automotive HMI trends like over-the-air up...
Watch Video
Ubuntu - The #1 Linux Distro is Built with Qt
The #1 Linux distro is more popular than ever — and on an even wider range of applications than you ...
Watch Video
Ulstein disrupts the automation industry with daring vision - Part II
The first project with Qt and The Qt Company services team, has enabled Ulstein Power & Control ...
Watch Video
Ultimate Scalability with Qt - Dev/Des 2021
www.qt.io https://www.qt.io/product/qt6 Scalable solutions - the holy grail for each product creatio...
Watch Video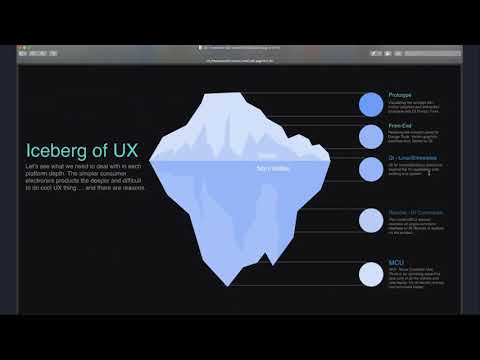
Variable Fonts: Creating a better in-car UX for consumers, Monotype {Qt Virtual Tech Con 2020}
Tom Rickner is a Creative Type Director with a career in type that spans more than three decades. Du...
Watch Video
Verolt's HomeChef Qt app connects web, embedded (MCU), and mobile {showcase}
Verolt Engineering created its HomeChef app for four different platforms: mobile, embedded, and web....
Watch Video
Virtual reality cockpit built with Qt Design Studio and Autodesk VRED
Try Qt Design Studio: https://www.qt.io/design Brook shows you a cool demo of an instrument cluster ...
Watch Video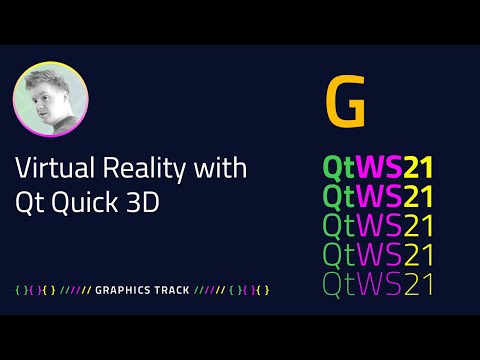
Virtual Reality with Qt Quick 3D | Graphics | #QtWS21
Rendering for virtual reality can prove challenging as not doing it correctly can make users feel il...
Watch Video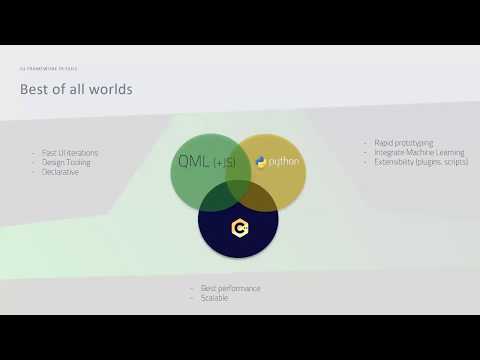
Welcome Meet Qt {Qt Virtual Tech Con 2020}
Marko Finnig, Product Director at the Qt Company kicks off the 2020 Virtual Tech Con with an introdu...
Watch Video
Welcome to Outrun - Behind the scenes
Welcome to behind the scenes of Outrun – the multi-screen digital cockpit demo for automotive built ...
Watch Video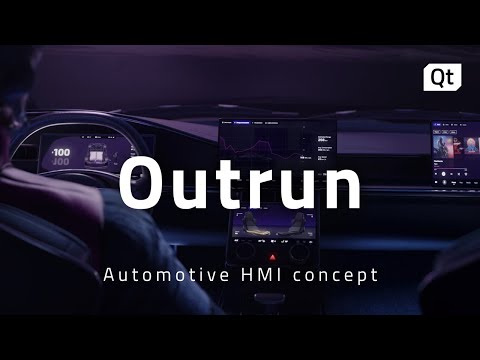
Welcome to Outrun - The full digital cockpit
Welcome to Outrun – an automotive UI demo showcasing the possibilities of building a multi-screen di...
Watch Video
What Does it Take to Add Data Encryption to a Qt Application? | Platform | #QtWS21
The current legislation in Europe together with the rise of cybercrime makes holding unencrypted pri...
Watch Video
What is Qt Design Studio? Explained by a Designer
Qt's Senior Technical Artist Arnaud Armengaud talks about the all-in-one UI design and prototyping t...
Watch Video
What is Qt for MCUs
Qt for MCUs is a complete graphics framework and toolkit with everything you need to design, develop...
Watch Video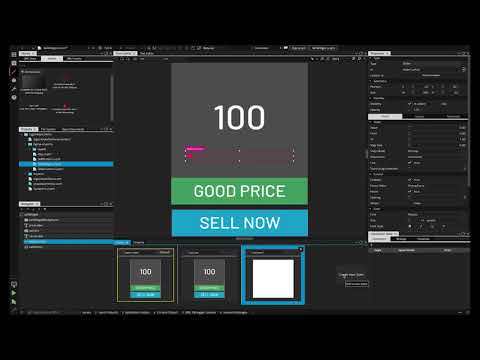
Where HMIs are going and how to develop them
The automotive industry is facing significant changes in technology, business models, supplier relat...
Watch Video
Why software is the new product differentiator - Dev/Des 2021
www.qt.io As companies move to the new post-pandemic reality, consumer demand for better and faster ...
Watch Video
Why to build your next IVI system with Qt and Android Automotive OS - Dev/Des 2021
Android Automotive is a new challenger in the infotainment segment. It brings a lot of benefits, mai...
Watch Video
Witekio's Touchscreen Coffee Machine UI Built with Qt Quick {showcase}
The French know their coffee. Turns out the lads at Witekio also know their Qt development. Check ou...
Watch Video
Yanfeng Visteon Built MCU HMI Development Platform with Qt
Yanfeng Visteon Built MCU HMI Development Platform with Qt Interview @ Qt World Summit 2021 China - ...
Watch Video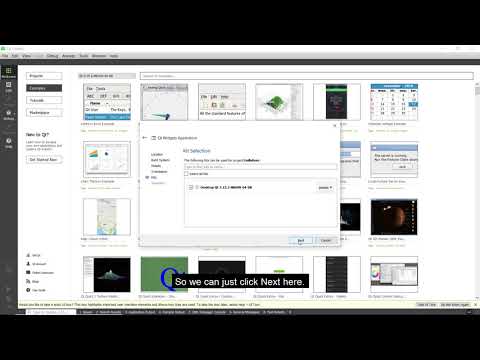
Creating a simple widget app
In this video, we'll show you how to create a simple widget-based application and run it on your dev...
Watch Video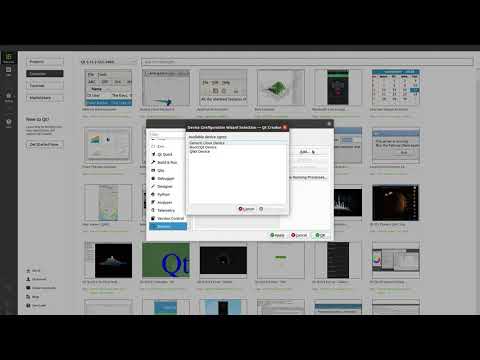
How to set up and deploy an application using Qt for Device Creation
In this video, we'll show you how to setup and deploy an example application for your device using Q...
Watch Video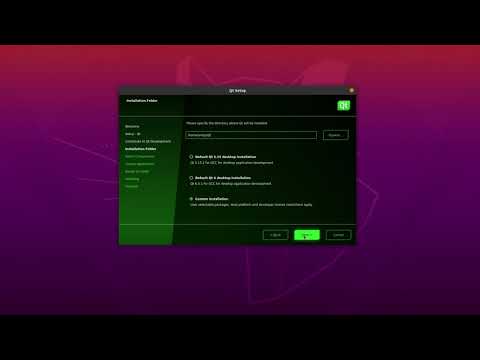
How to install and set up Qt for Device Creation on Linux
In this video, we'll show you how to download and install Qt for Device Creation with the options th...
Watch Video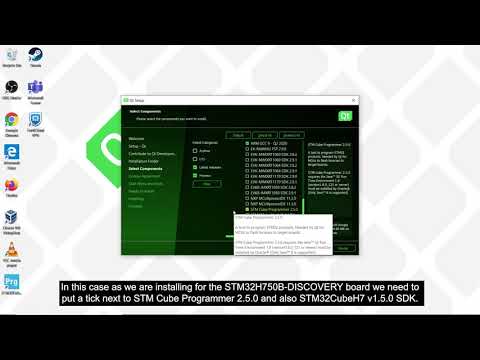
How to install and set up Qt for MCUs
In this video, we will show you how to download and install Qt for MCUs with the options that you wa...
Watch Video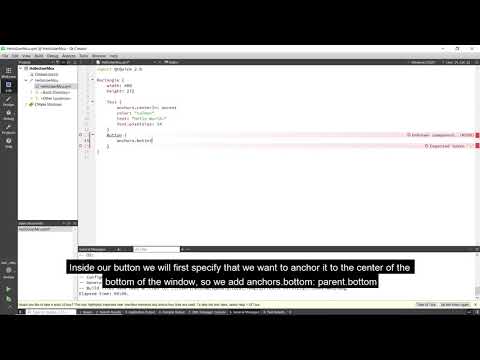
How to create a simple application with Qt for MCUs
In this video we will show you how to create a simple Qt for MCUs based application and run it on yo...
Watch Video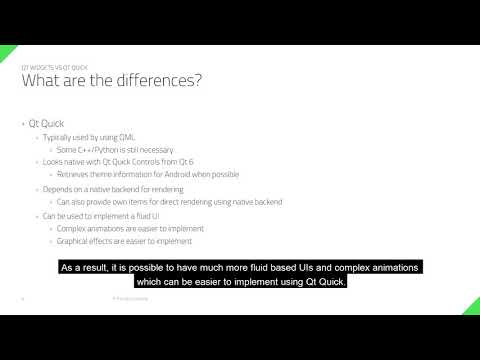
Qt Widgets or Qt Quick
In this video, we'll explain the differences between Qt Widgets and Qt Quick and how to make the rig...
Watch Video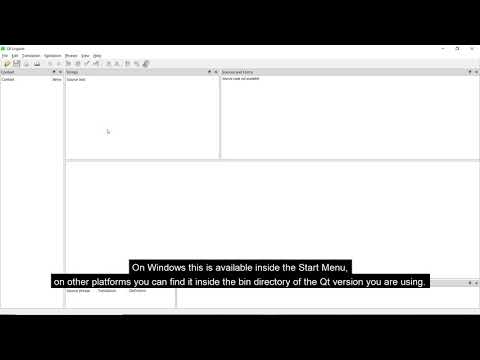
How to do translations with Qt Linguist
In this video, I will be showing you how to set up your Qt application ready for translation with th...
Watch Video
Debugging inside Qt Creator
In this video, we'll show you how to debug your application inside Qt Creator using the tools availa...
Watch Video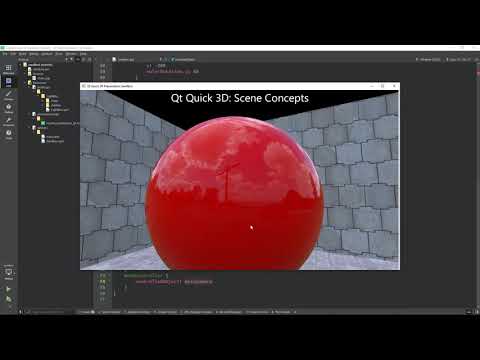
Qt Quick 3D: An Introduction and Best Practices
Andy Nichols shows us what Qt Quick 3D is, what you can do with it, and what it is best at – live in...
Watch Video
Getting Started with Qt {Qt Virtual Tech Con 2020}
Get started with Qt and its IDE, Qt Creator, and join our webinar where Qt’s Pre-sales Engineer will...
Watch Video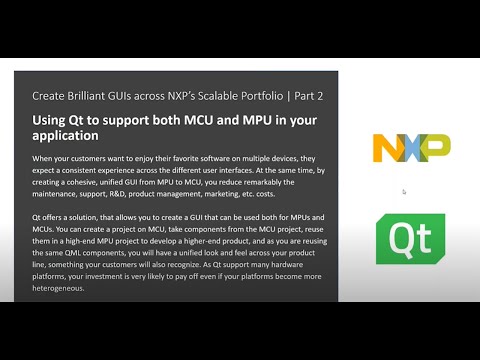
Using Qt to Support Both MCU and MPU in Your Application {On-demand webinar}
When your customers want to enjoy their favorite software on multiple devices, they expect a consist...
Watch Video
Calculating the ROI of Qt Software is not Rocket Science | #QtWS22
Customers and prospects sometimes wonder how to illustrate the financial value of Qt to decision-mak...
Watch Video
How to Know When it’s Time to Call in an Expert | #QtWS22
Software development projects are increasingly complex. Successful projects require skilled staff wi...
Watch Video
Transforming Your Business With Qt | #QtWS22
When you think of Qt, what is the first thing that comes to mind? Great product? Cross-platform capa...
Watch Video
Qt & QNX; Together Make a Safe, Secure, Robust Platform With a Compelling User Experience | #QtWS22
Qt and QNX; Two Q’s That When Deployed Together, Can Make a Safe, Secure, Robust Platform With a Com...
Watch Video
How to build QML apps for webOS and the Qt Creator webOS Plugin
When writing QML applications, one of the most important parts is how to set up your software archit...
Watch Video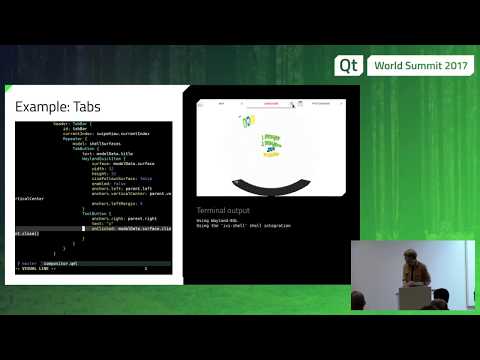
QtWS17 - Qt Wayland Compositor: Creating multi-process user interface, Johan Helsing, The Qt Company
This talk gives an in-depth presentation of the Qt Wayland Compositor API, showing you how to create...
Watch Video
Webinar: Creating Reusable and Scalable UIs with QML
Designing an interactive graphical component for Qt Quick QML is an easy task that can be done in ma...
Watch Video
Webinar: Development of Qt based Android Cockpit and Cluster
Watch this Webinar on Development of Qt based Android Cockpit and Cluster
Watch Video
Qt Robotic Arm Demo | Industrial Automation | Qt Group
Patrick Thurman, Product Manager at Qt Group walks us through the latest Industrial Automation demo ...
Watch Video
Improving the End-to-End Development Workflow for HMI in the Cloud
This is an AWS theatre session talk from CES 2024 by Juhapekka Niemi, SVP of Product Management at Q...
Watch Video
Shaper Tools builds CNC machines with Qt
Shaper Tools is shaping up to shape the shapes of the future. Donald Carr talks about how it's possi...
Watch Video
How to Create Reusable QML Components Across MCU and MPU Applications?
We explore how we can use Qt tools to create a unified UI for the whole range of your products, from...
Watch Video
Qt 6.7 Release - Scale to New Platforms and New Standards
Qt 6.7 focuses on the expansion of supported platforms and industry standards. It also has lots of l...
Watch Video
Qt 6.6 Release - Responsive Layouts, Qt Graphs & more
Qt 6.6 simplifies the process of creating complex user interfaces by providing additional higher-lev...
Watch Video
Lessons Learned from Teaching Design Studio to UX/UI Professionals with Marco Piccolino | #QtWS23
Abstract: Usually, when designers get to know Design Studio, they are both amazed and terrified. Thi...
Watch Video
Understanding the Qt Stack Trace with Volker Hilsheimer & Fabian Kosmale | #QtWS23
Abstract: Writing code means debugging code, and that means setting breakpoints and looking at stack...
Watch Video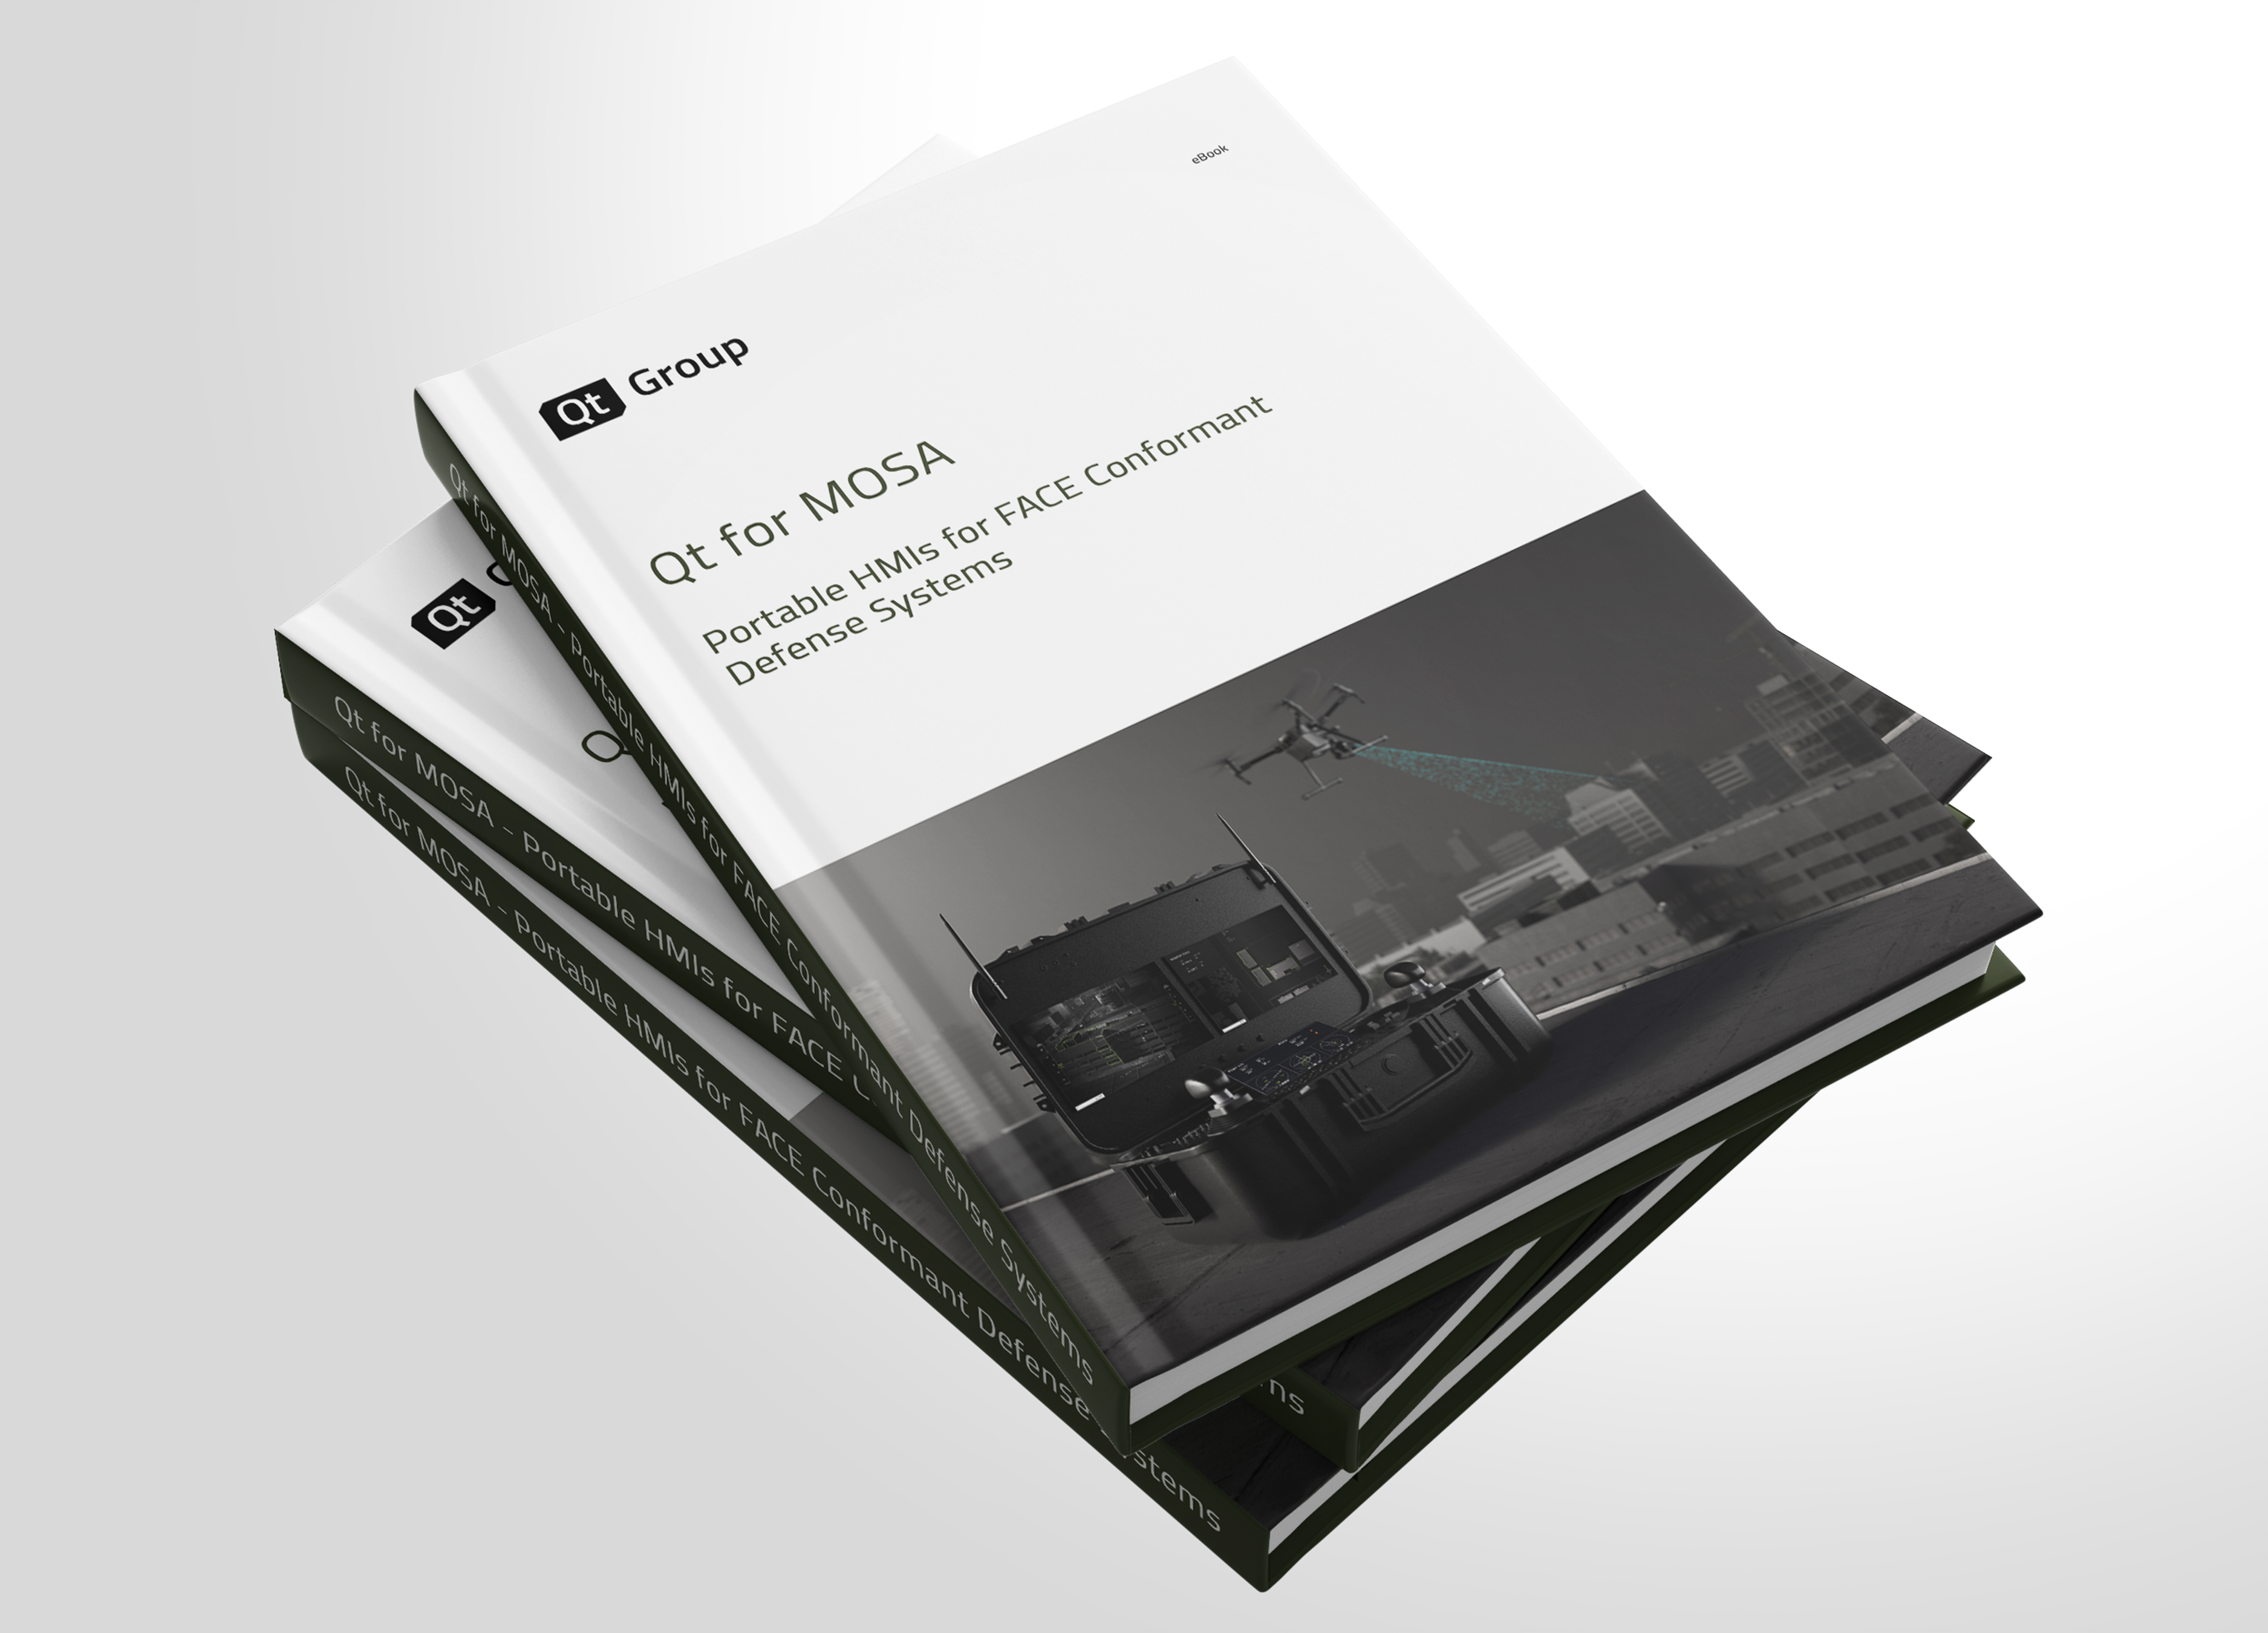
eBook: Qt for MOSA - Portable HMIs for FACE Conformant Defense Systems
To best fulfill the demands of the Aerospace and Defense sector, a new version of Qt has been released in conformance with the General-Purpose Profile...
Get Document
Elevating Quality Standards at Qt Group
Quality in software development has evolved into a strategic cornerstone for Qt Group, encompassing every stage of a product’s lifecycle—from developm...
Get Document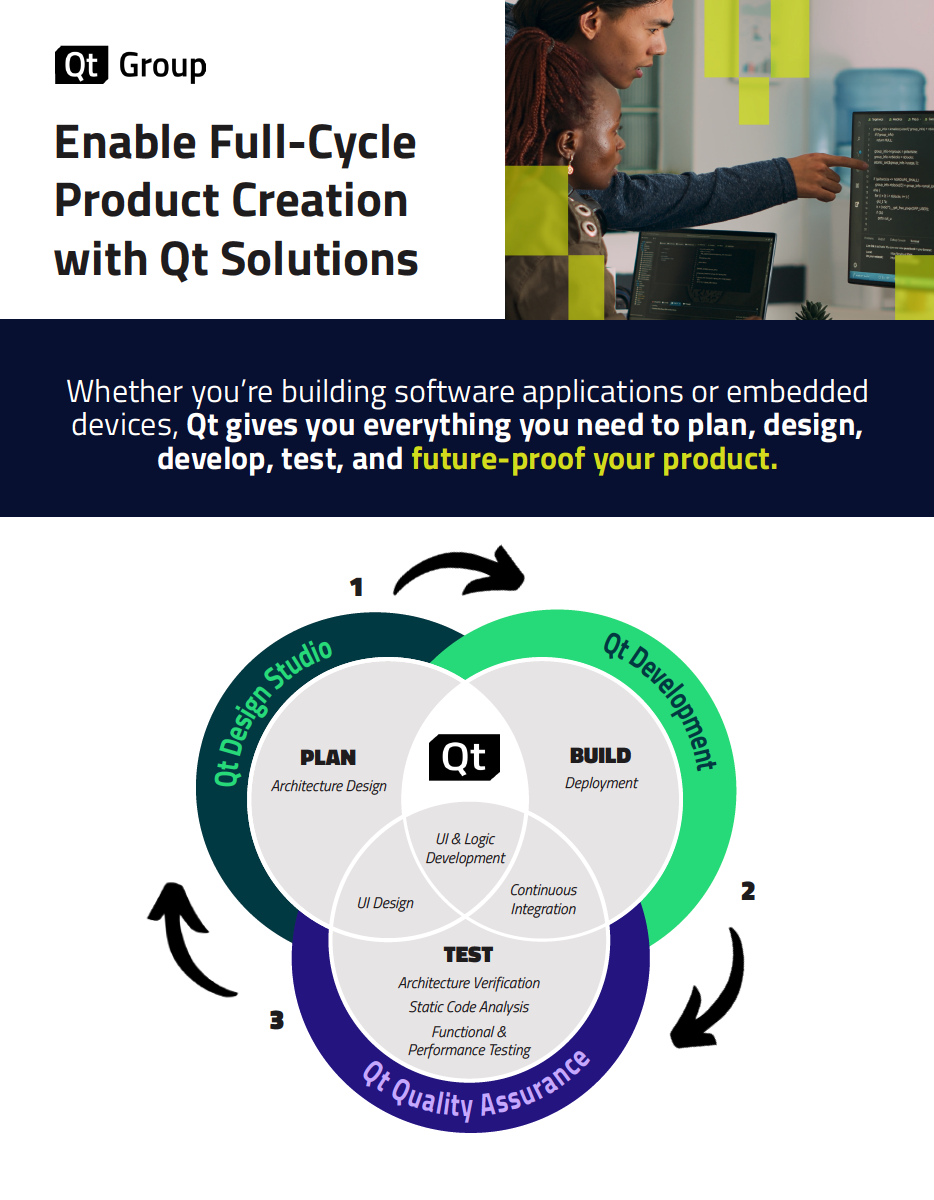
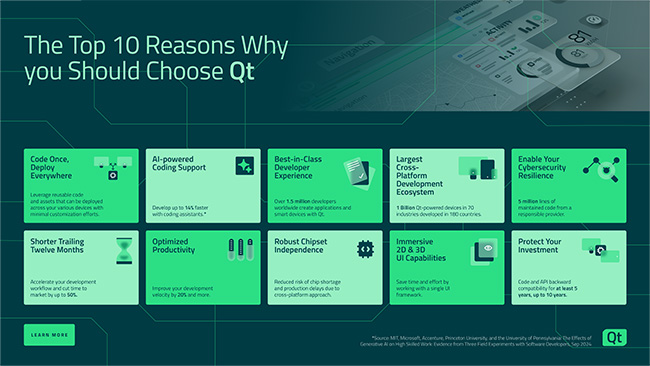
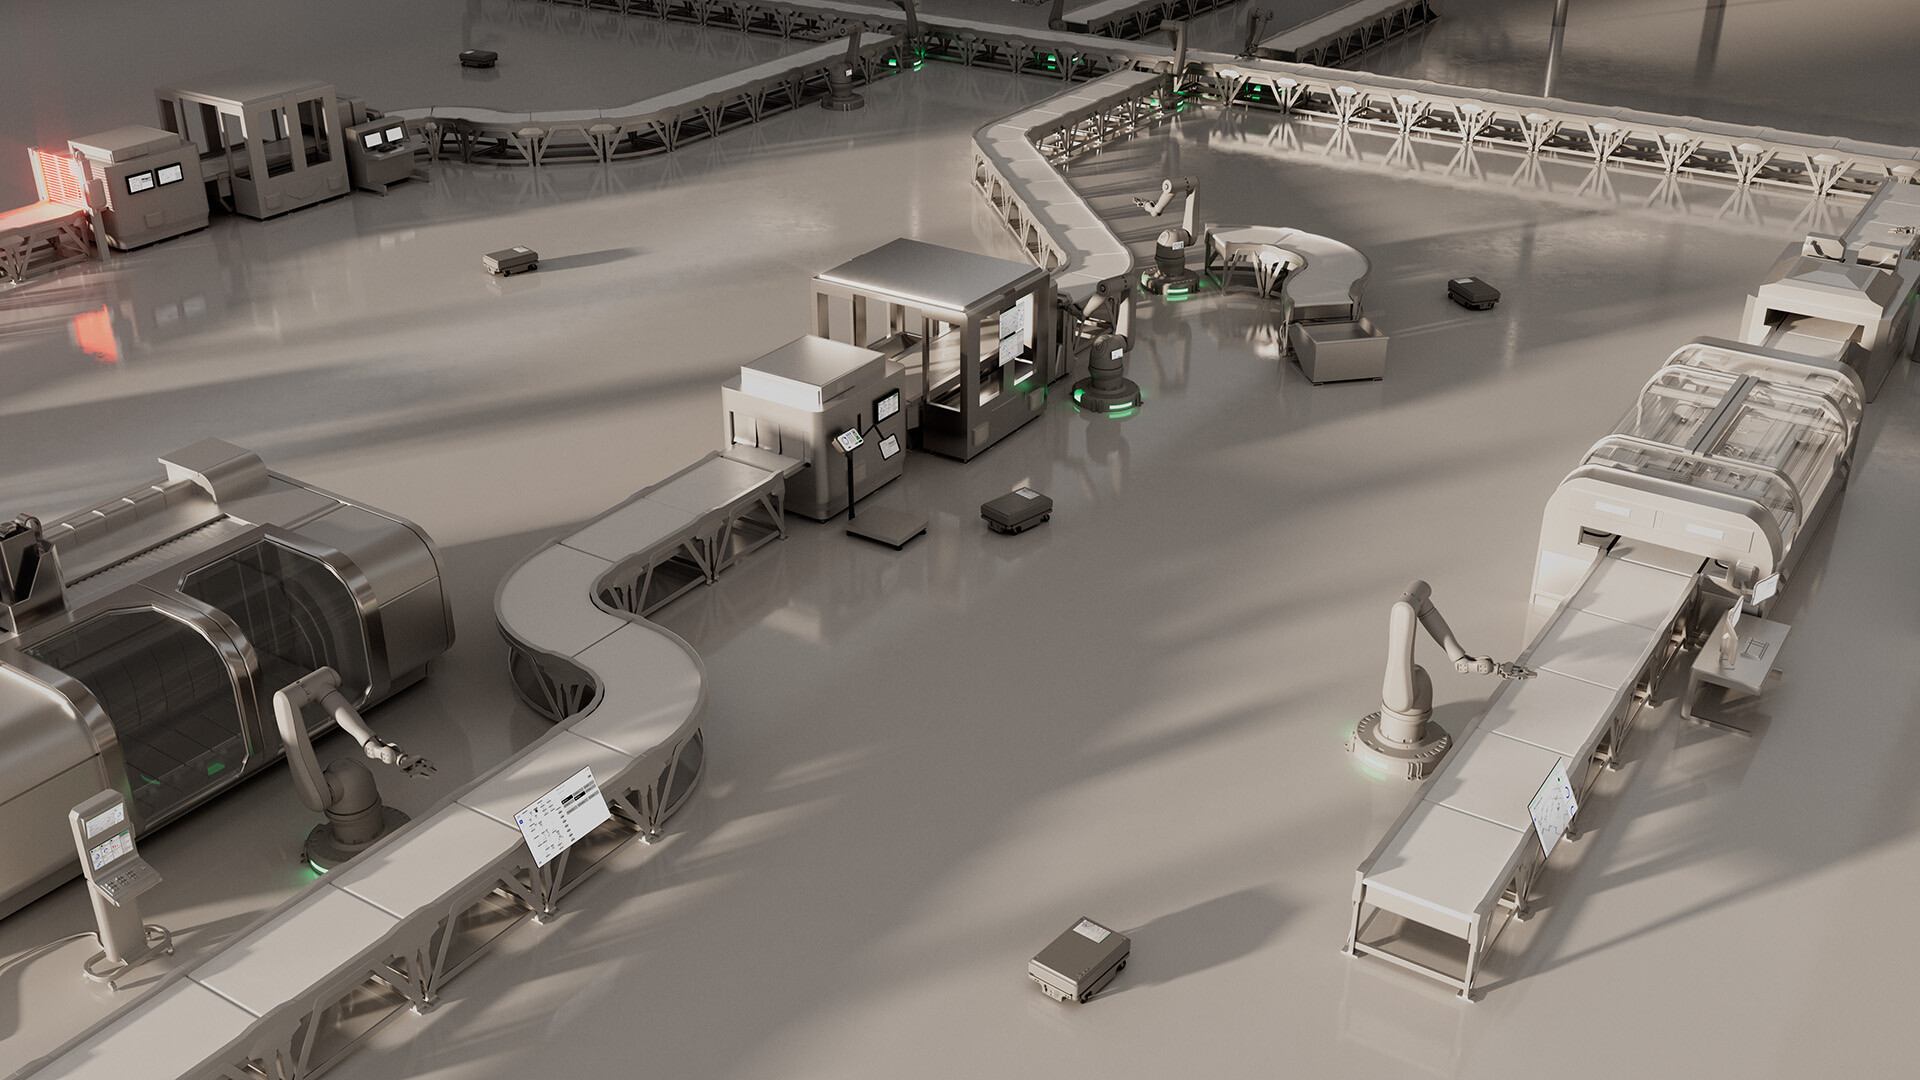
Cybersecurity in Industrial Automation: Securing the Future of Industrial Systems
Industrial automation is increasingly relying on software. To safeguard against advanced cyber threats, manufacturers and software providers need to m...
Get Document
The Road Ahead: Five Strategies that will Define Next-Gen Industrial Vehicles
Explore the key strategies and technologies shaping the future of industrial vehicles. From platform engineering to AI-driven innovations, discover ho...
Get Document
eBook: The Top 10 Reasons to Develop with Qt
Targeted to Managers, this eBook focuses on Development and the benefits of using Qt Framework and Qt tools to create iconic digital experiences effic...
Get Document.webp)
White Paper: Fostering High-Quality Embedded Software Development
Platform engineering delivers higher-quality software at a lower cost and in a shorter time. In April 2024, Qt Group commissioned Forrester Consulting...
Get Document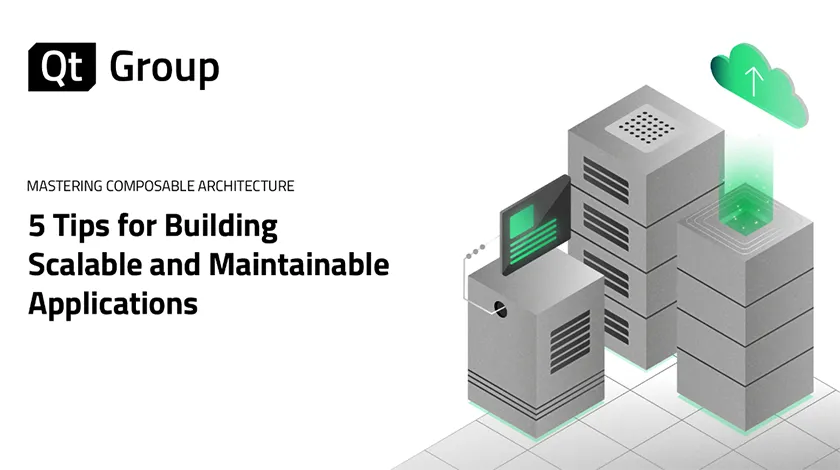
Infographic: 5 Tips for Building Scalable and Maintainable Applications
Master Composable Architecture with our infographic, tailored for developers seeking to craft scalable and maintainable software. Discover essential s...
Get Document.webp)
eBook: User Interface Design
This guide will help you navigate the mare magnum of UI software design, with valuable insights from the experience we, at Qt Group, have gained throu...
Get Document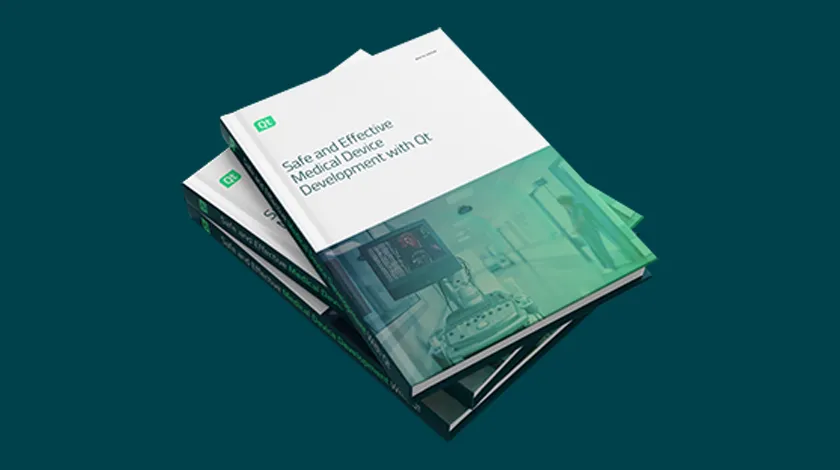
White Paper: Safe and Effective Medical Device Development With Qt
Looking to create powerful, cutting-edge medical devices that are both user-friendly and effective? Check out "Safe and Effective Medical Device Devel...
Get Document
White Paper: UX/UI Megatrends Shaping Today’s World
Welcome to our whitepaper on UX/UI megatrends! In today's fast-paced digital world, it's crucial for businesses to stay ahead of the curve when it com...
Get Document.webp)
Infographic: Code once deploy everywhere – with Limitless Scalability
Check out our infographic to further explore the possibilities of scaling UI development both on the horizontal and vertical axis.
Get Document.webp)
White Paper: Guide to Limitless Scalability
Are you interested in diving deeper into the topic? Download our free guide on Limitless Scalability to learn more and take your UI development to the...
Get Document
eBook: 8 things to know about WebAssembly
New to Qt for WebAssembly? Get this free guide to have a quick eight-question overview of all things related to WebAssembly – what it is, what to buil...
Get Document.webp)
White Paper: User Interface Design for Smart Appliances
Keeping up with the latest trends in user interface (UI) and user experience (UX) development while maintaining a consistent branded look and feel acr...
Get Document
Build and run embedded apps faster from qt creator with docker
Have you ever considered, what it would require to use containers to build and deploy applications to embedded targets? Of course, you have! So, in th...
Get Document
Driving Down Automotive Costs for Richer HMIs with Qt & i.MX RT1170
Automotive HMI solutions traditionally require complicated hardware and extensive architecture to accomplish every goal. In the world of microcontroll...
Get Document
Embracing Qt for Python
Join Qt R&D Manager Cristián and Academy Award Winning software engineer Paul with SilhouetteFX to hear about different use cases, best practices,...
Get Document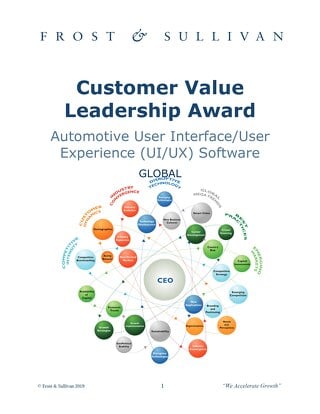
White paper: Customer Value Leadership Award for Automotive User Interface/User Experience Software
The Qt Company earns Frost & Sullivan's 2019 Customer Value Leadership Award. Best Practices Award for Automotive UI/UX Frost & Sullivan confi...
Get Document
White paper: Qt vs. HTML5 The Full-Stack Comparison
HTML5 and Qt are both terrific technologies. Choosing one for your next project is challenging. This white paper by sequality software engineering wil...
Get Document
Machine learning meets embedded development
Qt and Ekkono are working together to improve machine learning integration in the embedded development space. Ekkono have their own SDK, built to help...
Get Document
White Paper: Leveraging Human Factors Testing to Develop a Better MedTech Product
Usability and human factors testing are becoming requirements rather than “nice-to-haves” across a wide array of industries that make products we use ...
Get Document
White paper: Migrating Applications from MPUs to MCUs
This white paper shares Verolt Engineering's experience of porting an existing Qt Quick application to a microcontroller (MCU) with Qt for MCUs. They ...
Get Document
White paper: Qt & Android
Witekio performed an unbiased and exhaustive real-life comparison from the point of view of three embedded software development experts by creating a ...
Get Document
White Paper: The Embedded Developers' Guide to Zero Installation
This whitepaper explores how zero installation has evolved to be what it is today, describes the components in a typical solution, outlines specific t...
Get Document
Smarter Products Need Smarter Development
This is a commissioned study conducted by Forrester Consulting on behalf of The Qt Company, published on May 17th 2021. Executive Summary; Digital, co...
Get Document
The Embedded Product Planning and Requirements Guide
How do you approach building a new embedded or IoT device? The legacy method for doing this was relatively straightforward: outline your requirements,...
Get Document
White Paper: The Perfect Framework for Industrial Applications
Requirements for the industrial market now include streamlined design workflows, multiple target deployments, remote browser accessibility, connectivi...
Get Document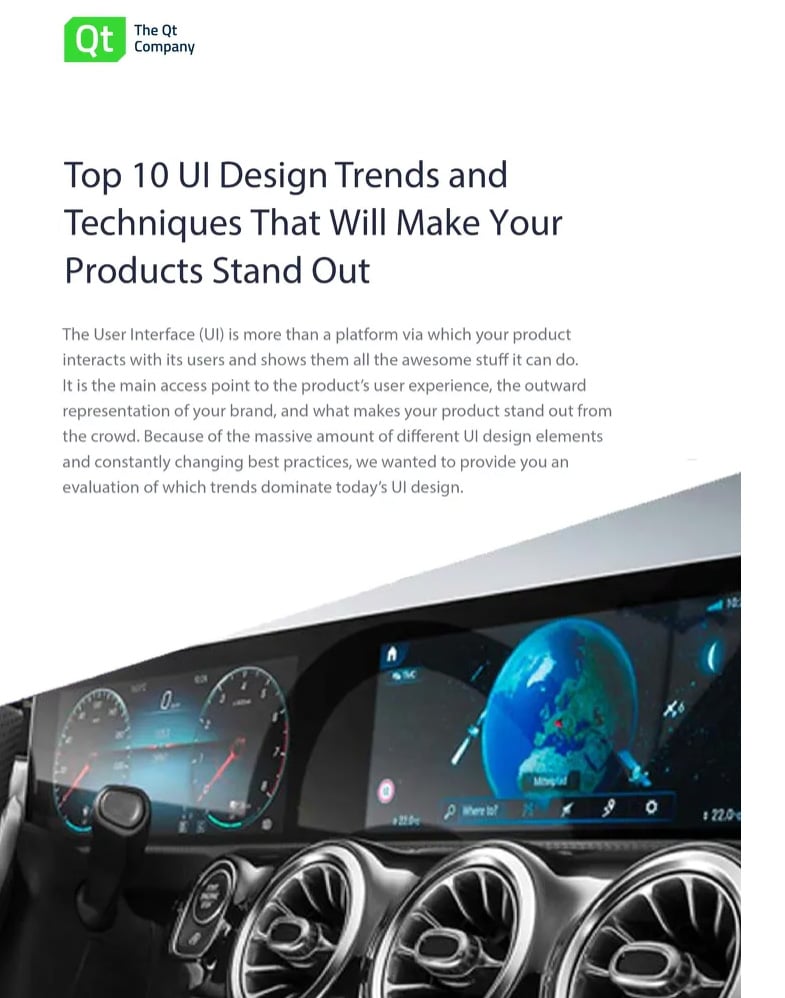
Top 10 UI Design Trends and Techniques that will make your products stand out
The User Interface (UI) is more than a platform via which your product interacts with its users and shows them all the awesome stuff it can do. It is ...
Get Document
UI/UX Design Trends in Appliances
The complexity and level of graphical details for home appliances User Interfaces are significantly increasing in the last years. Starting from the an...
Get Document
White paper: Best Practices for a Successful Development Project
In this paper, Qt Professional Services engineering teams share some of the best practices they have found over the years and continue to work by. We ...
Get Document
White paper: Beyond the Code
This whitepaper explores the requirements of UI design for software systems and provides hints, tips and suggestions for anyone tasked with developing...
Get Document
White paper: Building the IoT and How Qt Can Help
This whitepaper defines what the requirements are for developing IoT software, compares frameworks and describes the advantages of using Qt to develop...
Get Document
White paper: Driving the Automotive User Interface
Motor show concept cars have traditionally attracted attention through outrageous body styling, but today’s advanced demonstrators place at least as m...
Get Document
White paper: Forrester Study | The Total Economic Impact™ of Qt for Device Creation
In the race to bring profitable innovation and product improvements to the mass markets for digital user interfaces, pressure grows to reduce costs an...
Get Document
White paper: Functional Safety & Qt
Download our white paper discussing the general requirements for functional safety, how the requirements vary depending on industry and what Qt’s reco...
Get Document.jpg)
White paper: Medical Choosing Commercial Off the Shelf (COTS)
This whitepaper explores the options of choosing a commercial off the shelf software and developing a software from the scratch. The choice may carry ...
Get Document
White paper: Offering for the Medical Industry
This white paper explains how to create FDA- and EU-certified medical systems, how to meet demands of reducing the total costs of ownership (TCO), and...
Get Document
White paper: Qt Conquers the Automotive Interior
This white paper is about the development of today’s sophisticated digital car interiors and why Qt turns out to be the platform of choice. We’ll look...
Get Document
White paper: Qt vs HTML5 #1 Practical Comparison
One man takes 160 hours to create a demo application of an embedded system using Qt & QML and the same number of hours to create the very equivale...
Get Document
White paper: Qt vs HTML5 #2 Million Dollar Question
In this white paper, Burkhard Stubert explains how he could save one of the world’s largest home appliance manufacturers millions of Euros by choosing...
Get Document
White Paper: The Nuts and Bolts of Qt Industrial Applications
If you read our last eBook, The Perfect Framework for Industrial Applications, you may already know that Qt is well suited for building industrial app...
Get Document
White Paper: The Insider's Guide to Excellent UX for the Non-UX People
User experience (UX) is a term you can’t avoid these days. That’s because an excellent UX can more easily provide something that most other facets of ...
Get Document
Companion App Design with Qt
Mobile-based companion applications are becoming ubiquitous, especially within IoT consumer product offerings. Thankfully, the design (and also develo...
Get Document
How are Companies Overcoming the Global Chip Shortage
61 % of decision makers agree that the current semiconductor shortage has negatively impacted their ability to deliver new products, according to a re...
Get Document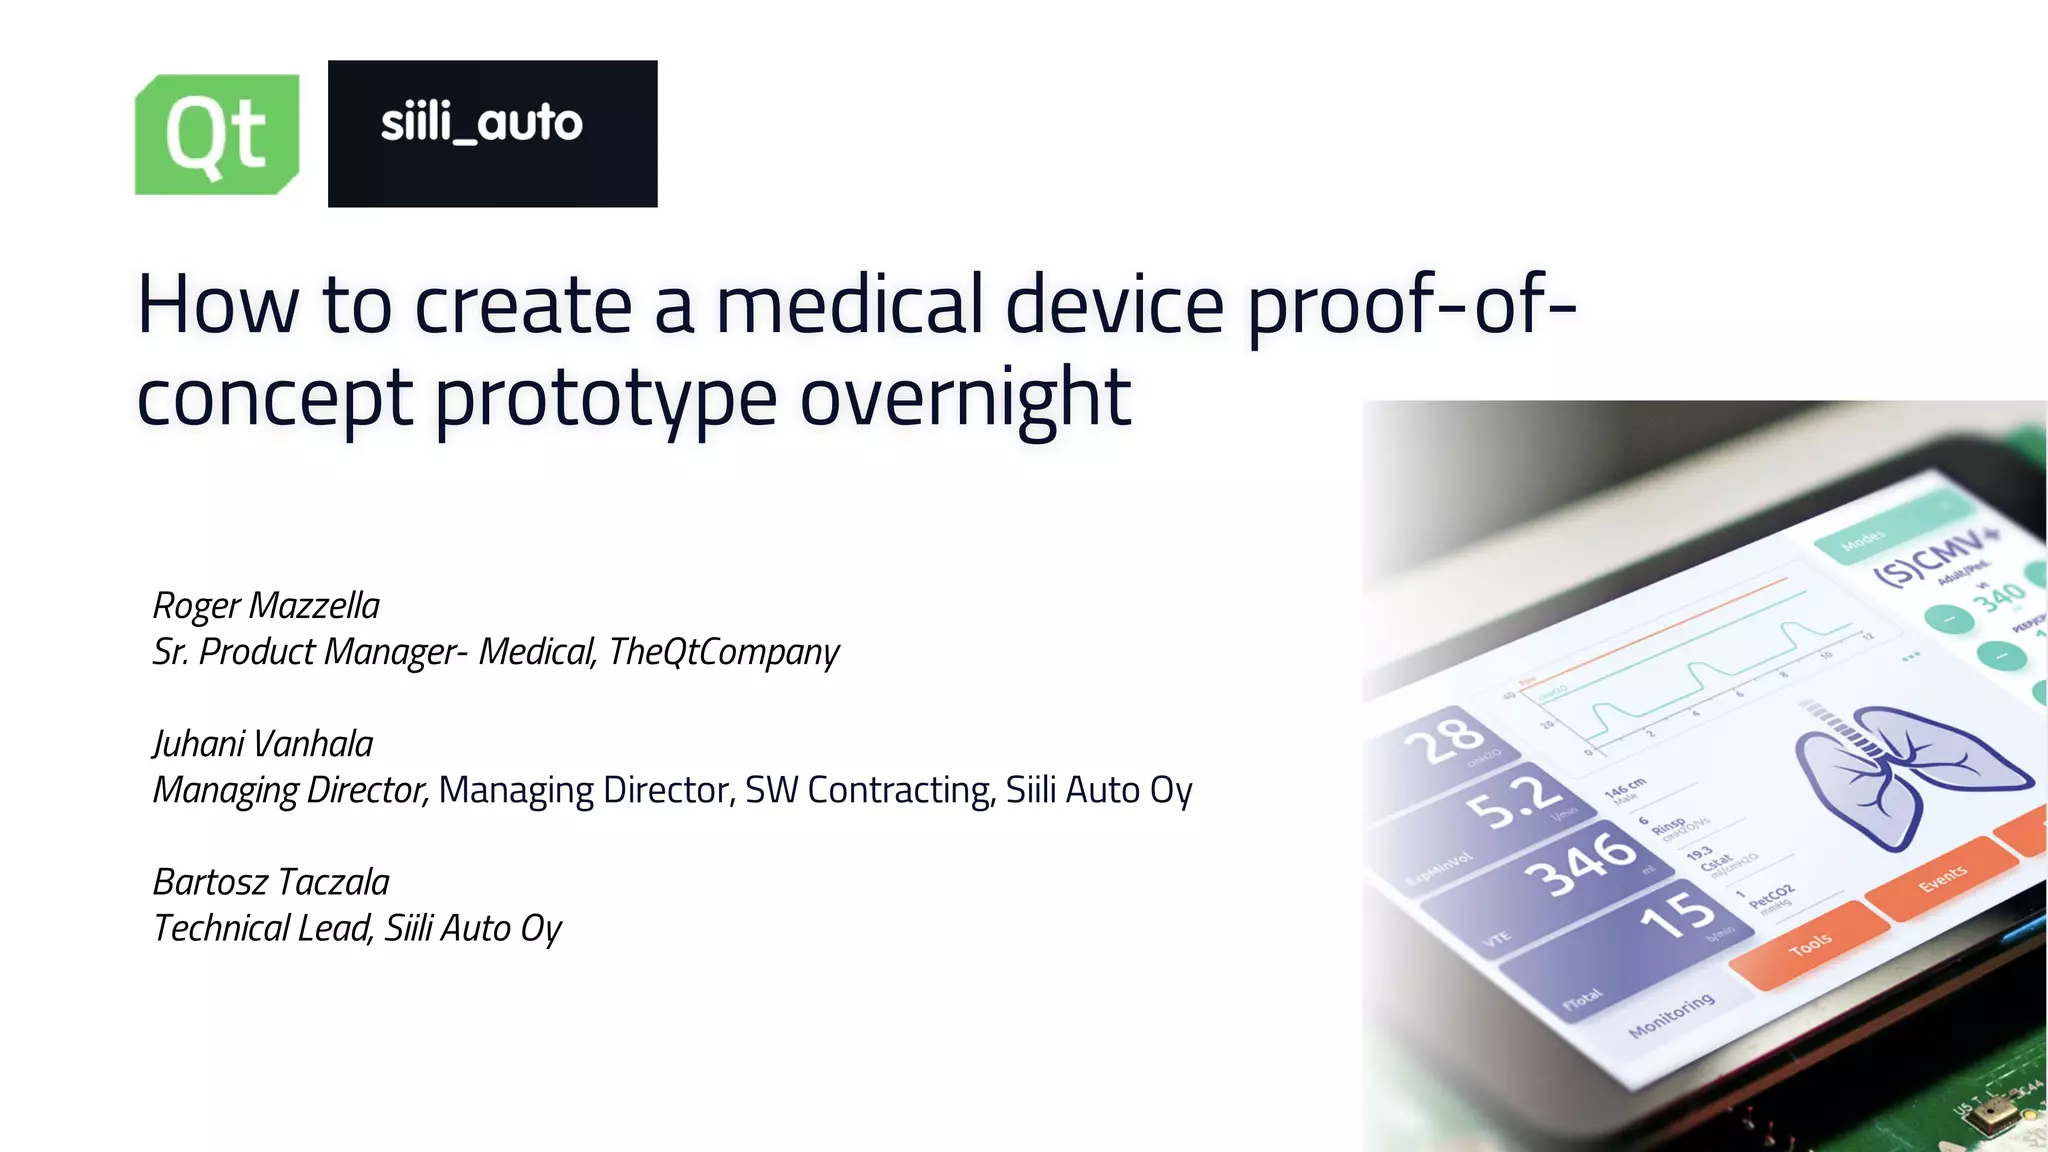
How to create a medical device proof of-concept prototype overnight
In the wake of the COVID-19 crisis, the creative technology studio Siili Auto together with The Qt Company, recently launched a new graphical user int...
Get Document
Improve Time to Market for Industrial Edge Devices
Qt and WINSYSTEMS have collaborated to provide an out of box experience on industrial-grade embedded computing platforms that will have you developing...
Get Document
Learn how to addressing medical and industrial challenges with BlackBerry QNX and Qt
The QNX® Neutrino® and its safety variant, the QNX® OS for Safety, are widely regarded as safe and secure operating systems for embedded devices, and ...
Get Document
Meet Qt 6.0
Join Lars Knoll and Tuukka Turunen to learn about the all-new Qt 6 with Q&As. Qt 6 offers you The Productivity Platform for the Future. We want to...
Get Document
Meet Qt Canada
Qt helps develop industry-leading technologies with one line of code at a lower cost and more scalability than ever before. Join us to learn how to go...
Get Document
Qt 6.2 lts vs. qt 5.15 the big feature parity comparison
We have built Qt 6 as the Productivity Platform for the Future to empower Next-Generation 3D/2D User Experiences with Limitless Scalability. In our up...
Get Document
Qt Safe Renderer and Top 5 Qt Questions
Now that QSR 1.2 is just around the corner and bringing Animations to the Safe Renderer, it’s time to learn how to get moving with the Safe Renderer! ...
Get Document
Top 10 User Interface Trends
Top 10 User Interface Trends, in which modern UI designers have been developing & implementing during the 2020 year. The trends we discuss, are ba...
Get Document.png)
Create Your Advanced Driving Assistance System with Qt Surrounding Reality HMI Template
Developed and actively maintained by Qt Group, Qt Surrounding Reality (SR) HMI Template delivers cutting-edge functionalities—such as lane detection, ...
Read More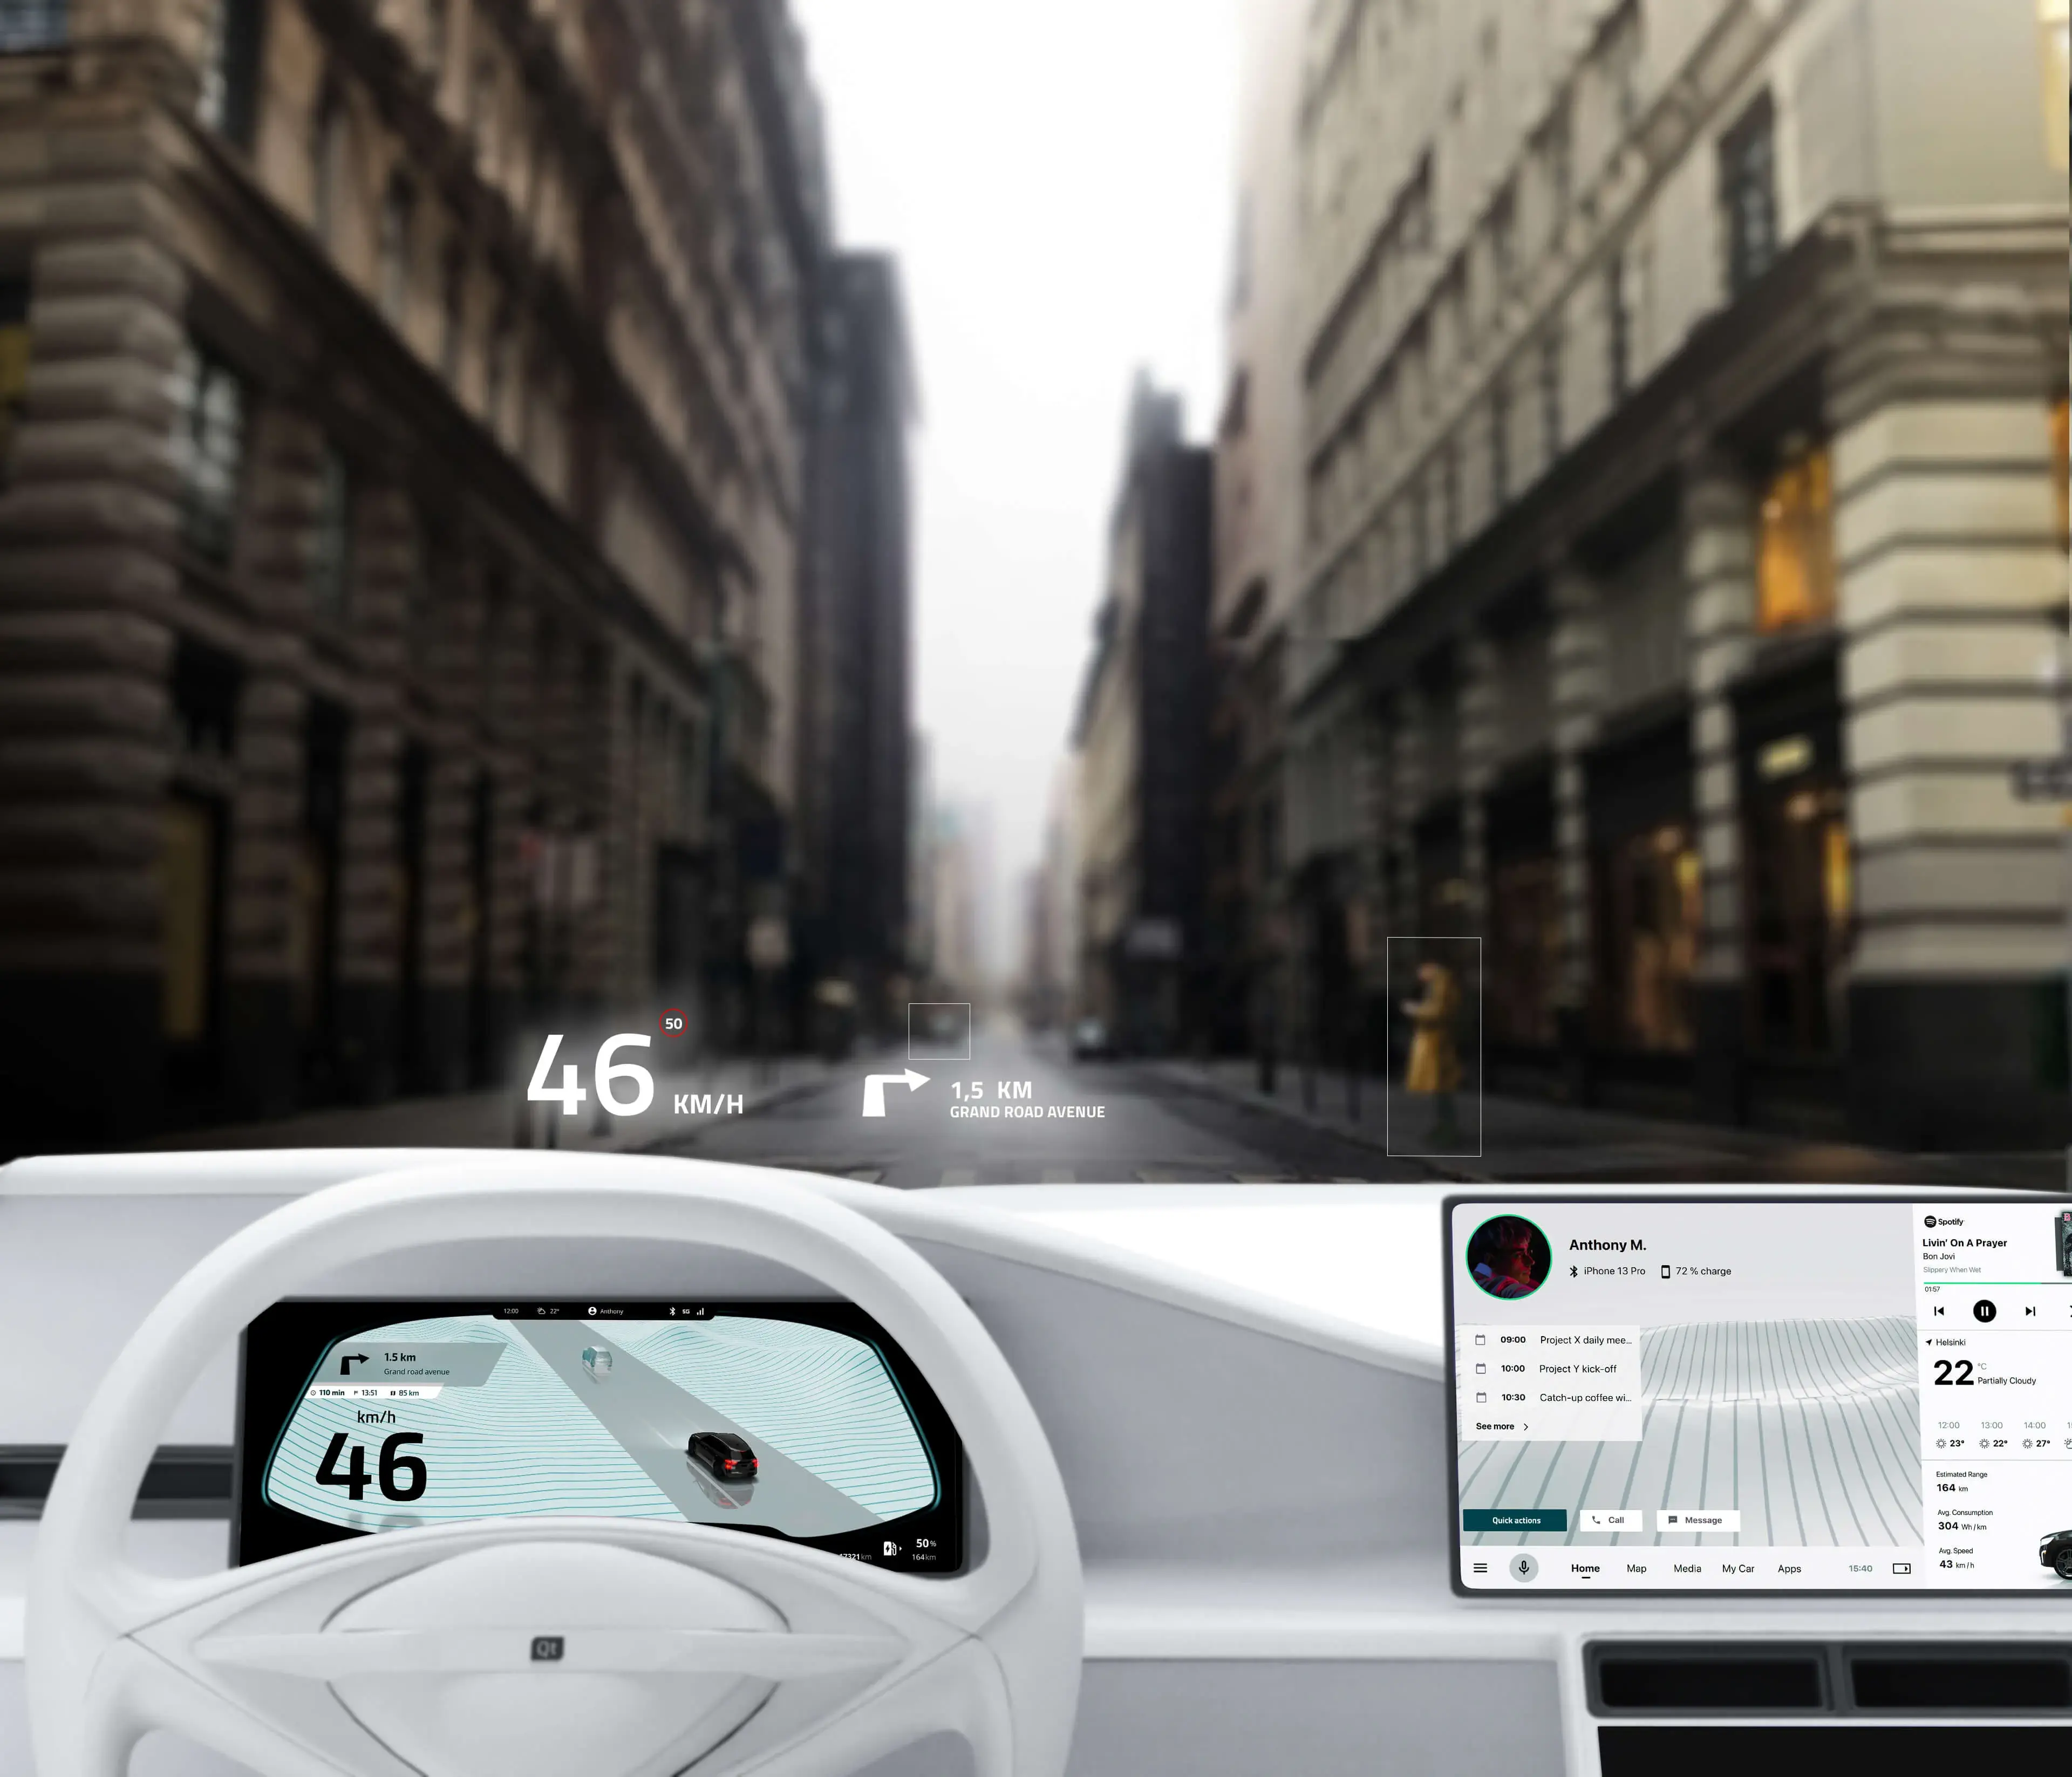
Article: What Modern Automotive HMI Graphics Demand in the SDV era
Discover how modern automotive HMIs in software-defined vehicles use advanced graphics to elevate user experience while maintaining safety and complia...
Read More
Ebook: The Recall Prevention Playbook for MedTech Leaders – How to Achieve Regulatory Enablement and Ship Faster
This is a playbook for MedTech leaders tired of stagnant compliance and regulatory processes and ready to establish an infrastructure for building lon...
Read More
Ebook: GPU Acceleration or Unmanageable Compliance Risk? – The Leader’s Wake-Up Call to Functional Safety
This is your playbook for speed AND safety through a proper compliance verification infrastructure that also saves you from liability risks. Your orga...
Read More
Foilone | Built with Qt
Learn how Qt Professional Services helps the Marine Industry fast-track HMI development with out-of-the-box solutions that are deployed in a week whil...
Read More
CLEAN MOTION | Built with Qt
Learn how Qt Professional Services helps the Motor Vehicle's industry fast-track HMI development with out-of-the-box solutions that are deployed in a ...
Read More.png)
Demo: Industrial Automation
Qt Group's Industrial Automation demo highlights how the Qt Framework's capabilities for Industrial IoT—such as graphics, connectivity, and cross-plat...
Read More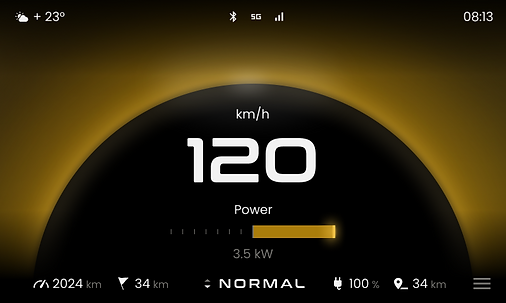
Demo: Eclipse Two-Wheeler Reference HMI
Deliver cutting-edge functionalities—such as navigation, connectivity, and advanced graphics—on cost-effective platforms by leveraging Qt for MCUs opt...
Read More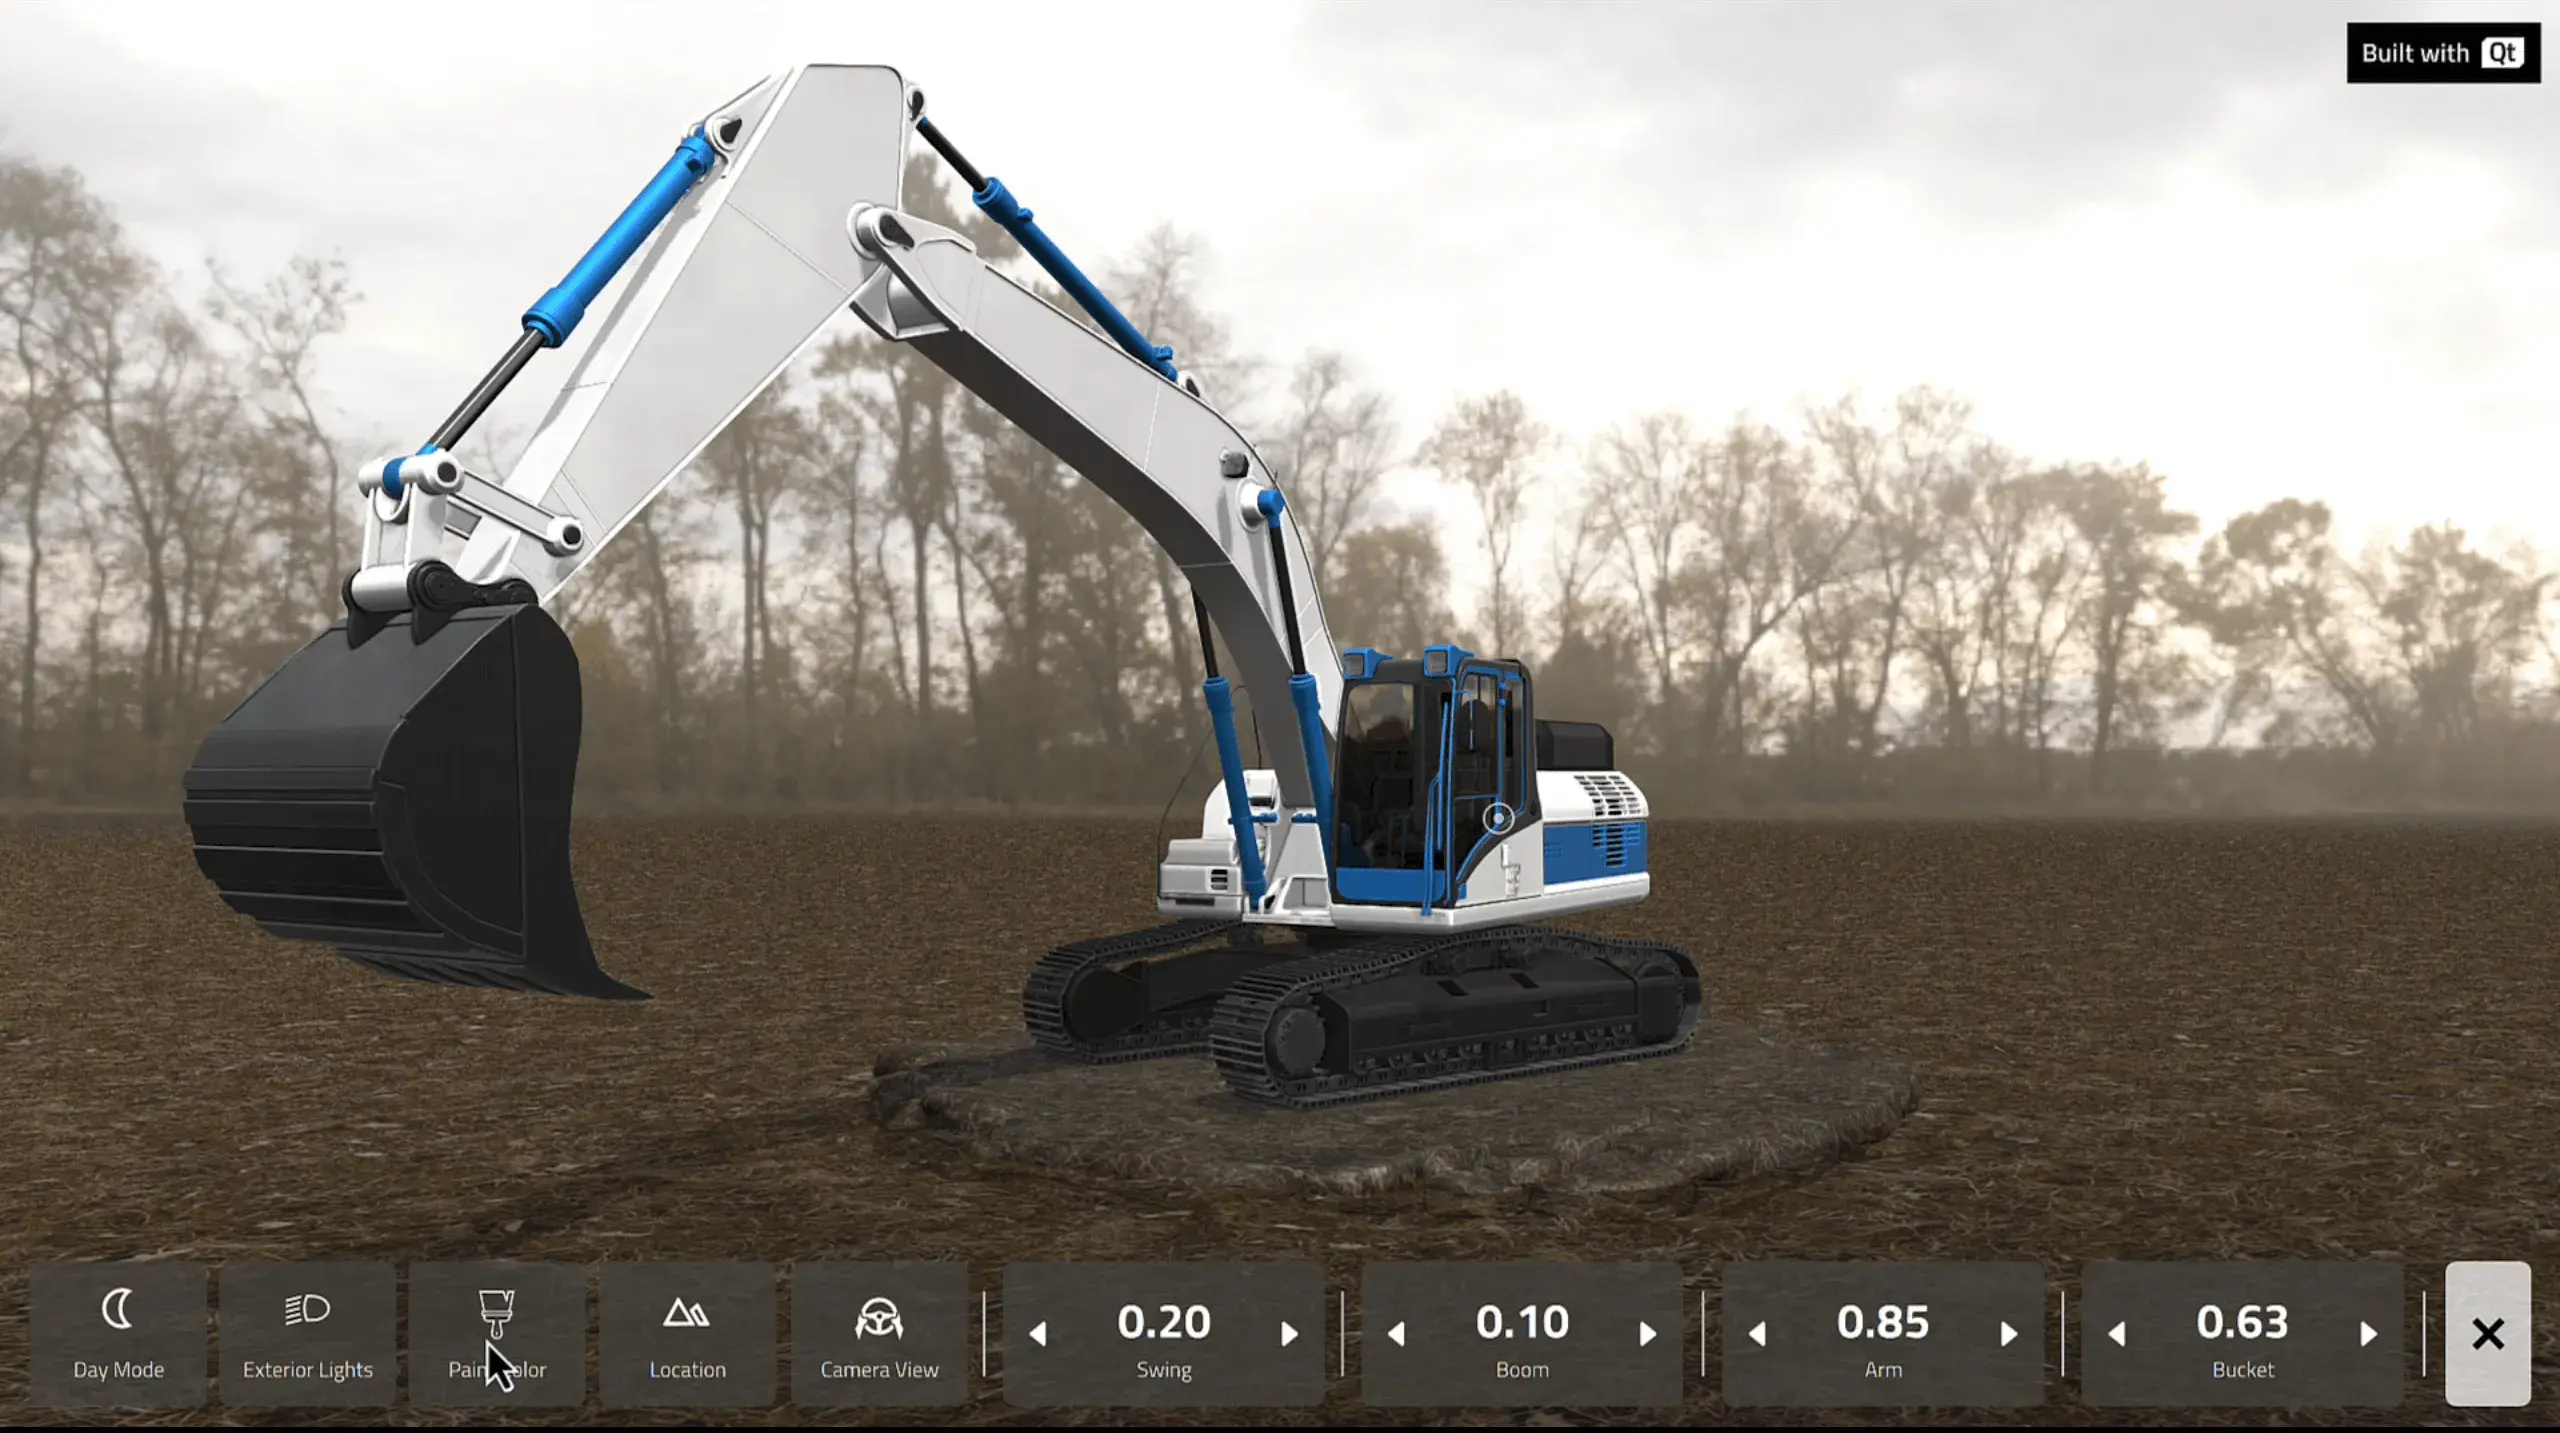
Demos: Industrial Vehicles
Qt Group maintains a constant commitment to developing cutting-edge functionality that enhances safety, efficiency, and productivity in the next gener...
Read More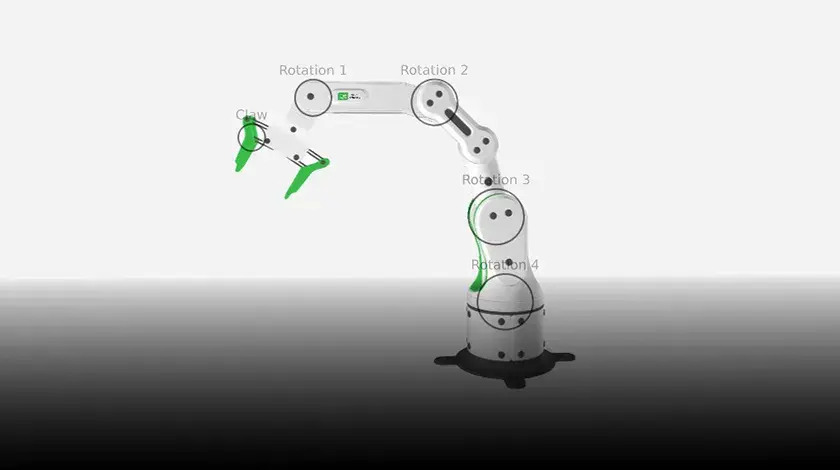
Demo: Industrial Automation
Interactive industrial robot arm in a Qt Quick 3D scene showcasing how to add a C++ backend to a 3D project from Qt Design Studio.
Read More.webp)
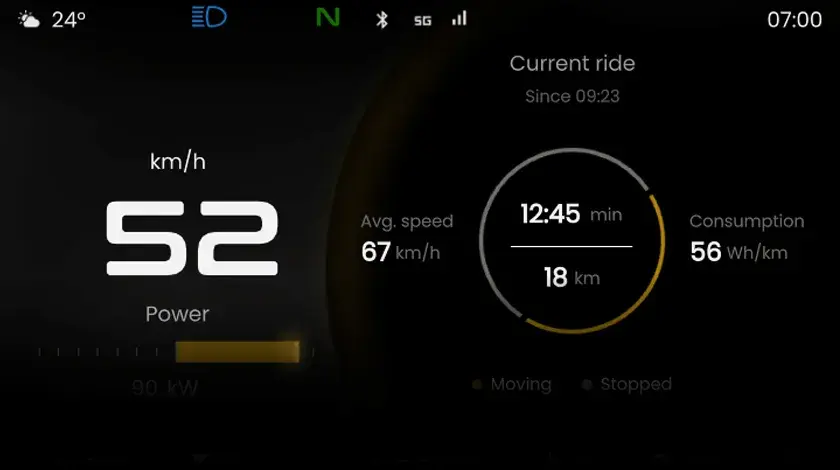
Demo: Eclipse App
Eclipse runs on cost-effective hardware, delivering cinematic animations, real-time data, and smartphone-powered apps via touchscreen or buttons.
Read More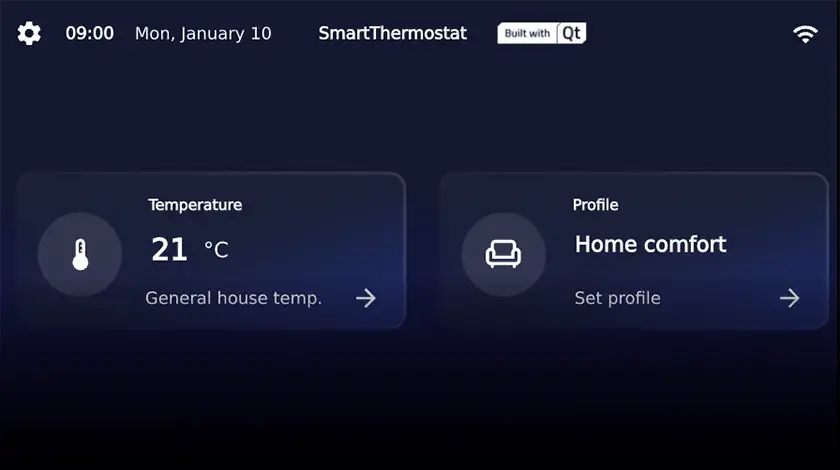
Demo: Smart Home HVAC
Running on a tablet or other high-end hardware, the HUB enables seamless interaction with each connected device via widgets mirroring the interface of...
Read More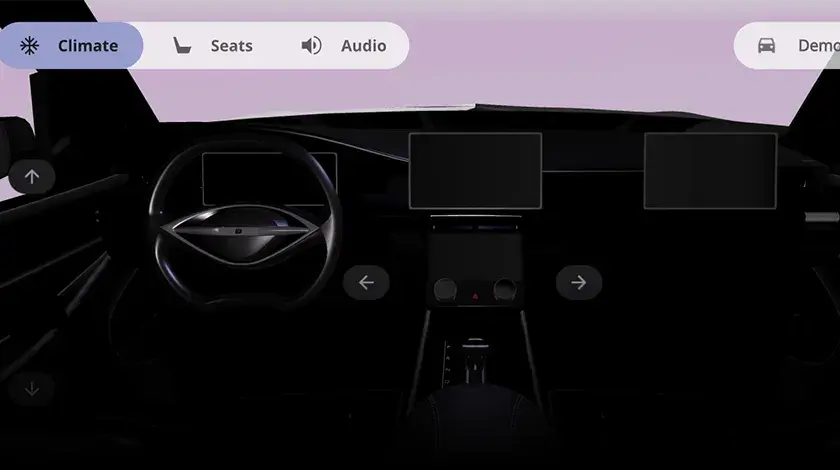
Demo: Outran HVAC
In-vehicle air-control system leveraging particles and 3D graphics for an immersive experience at your fingertips.
Read More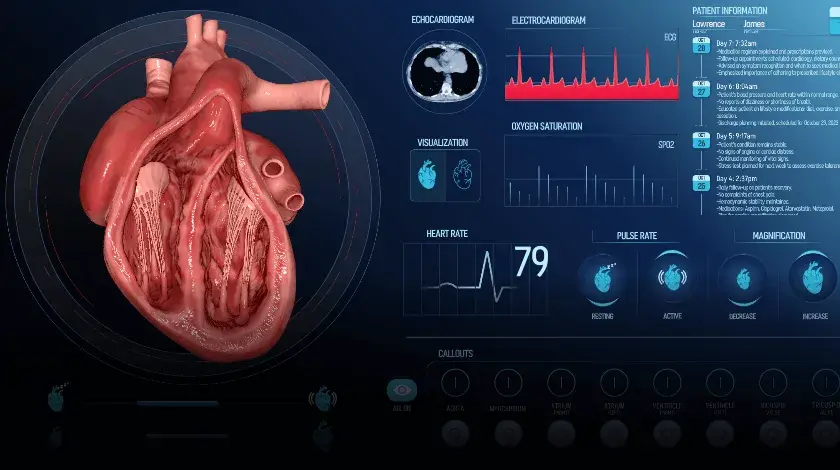
Demo: Echo Cardio
Animated beating heart which can be manipulated/visualized with various controls, including 2D assets, a 3D FBX model, animations, interactive buttons...
Read More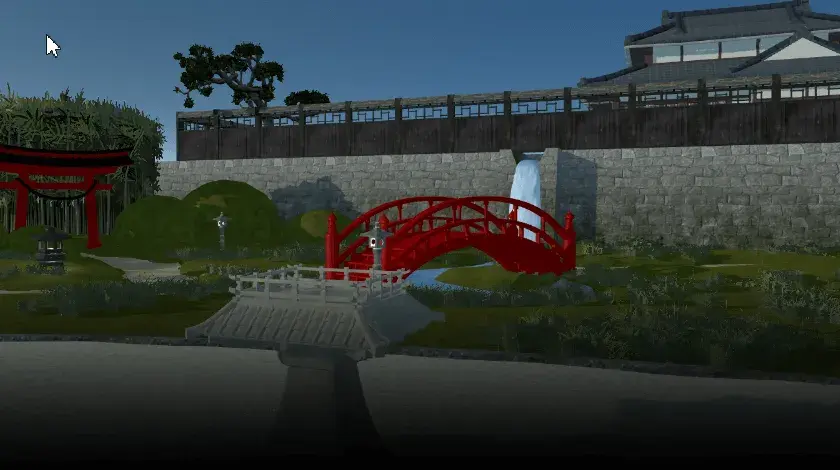
Demo: Particles Effects
Improved ready-made effects from Qt Design Studio placed in a high-quality 3D scene with various visual elements reacting to effect, e.g. explosion.
Read More.webp)
Demo: Quick Effect Maker
Showcasing some of Qt 6.8 graphics effects (including MaskedBlur, Glow, CircleBend, SpriteAnimation) in a single interactive app.
Read More
Demo: Mesh Morphing
A lightweight demo showcasing multiple different morphing scenes, including large-scale, micro-adjustments, and more.
Read More
Demo: Physically Based Rendering
Different types of new ready-made materials to let users rapidly prototype their work— 30+ PBR materials accessible and editable through material brow...
Read More
Ebook: Rethinking Functional Safety – When Safety Standards Become Your Market Differentiator
This guide is for Engineering Leaders who are tired of the endless tug-of-war between speed and safety. Learn how to transform quality from a cost cen...
Read More
Qt Smart Health Project
Leverage Qt Framework's advanced graphics, connectivity, and secure code practices to build the Smart Health solutions of the future, where intuitive ...
Read More
Article: How to Optimize Automotive HMI Performance in Software-Defined Vehicles
High-performance computers may replace Electronic Control Units, but hardware alone cannot guarantee smooth, reliable user experiences. Automakers mus...
Read More
Blog: The iPhone Moment for Automotive has Arrived. Will OEMs Seize It?
The automotive industry is entering one of the most profound transformations in its 100+ year history. The shift to Software-Defined Vehicles (SDVs) i...
Read More
Blog: Ensuring Safety in Embedded Systems for Micro-Mobility
High-end electric bikes and motorcycles typically use microprocessors (MPUs) to power digital dashboards that provide riders with real-time data, navi...
Read More
Blog: Build High-End Two-Wheeler HMIs Cost-Effectively
With the advent of digitalization and electrification in the realm of two-wheelers, speed and a powerful engine are no longer the core expectations of...
Read More
Blog: Why the Micro-Mobility Sector is Betting on Robust and High-Performance Systems
Two-wheelers in the same category sell at very similar price points. What ultimately makes or breaks the deal are the features and quality that manufa...
Read More
Blog: Why Rapid Prototyping is Key to Micro-Mobility Sector Success
In the micro-mobility sector, the winners aren’t the biggest or cheapest; they are the fastest to deliver the features that differentiate their produc...
Read More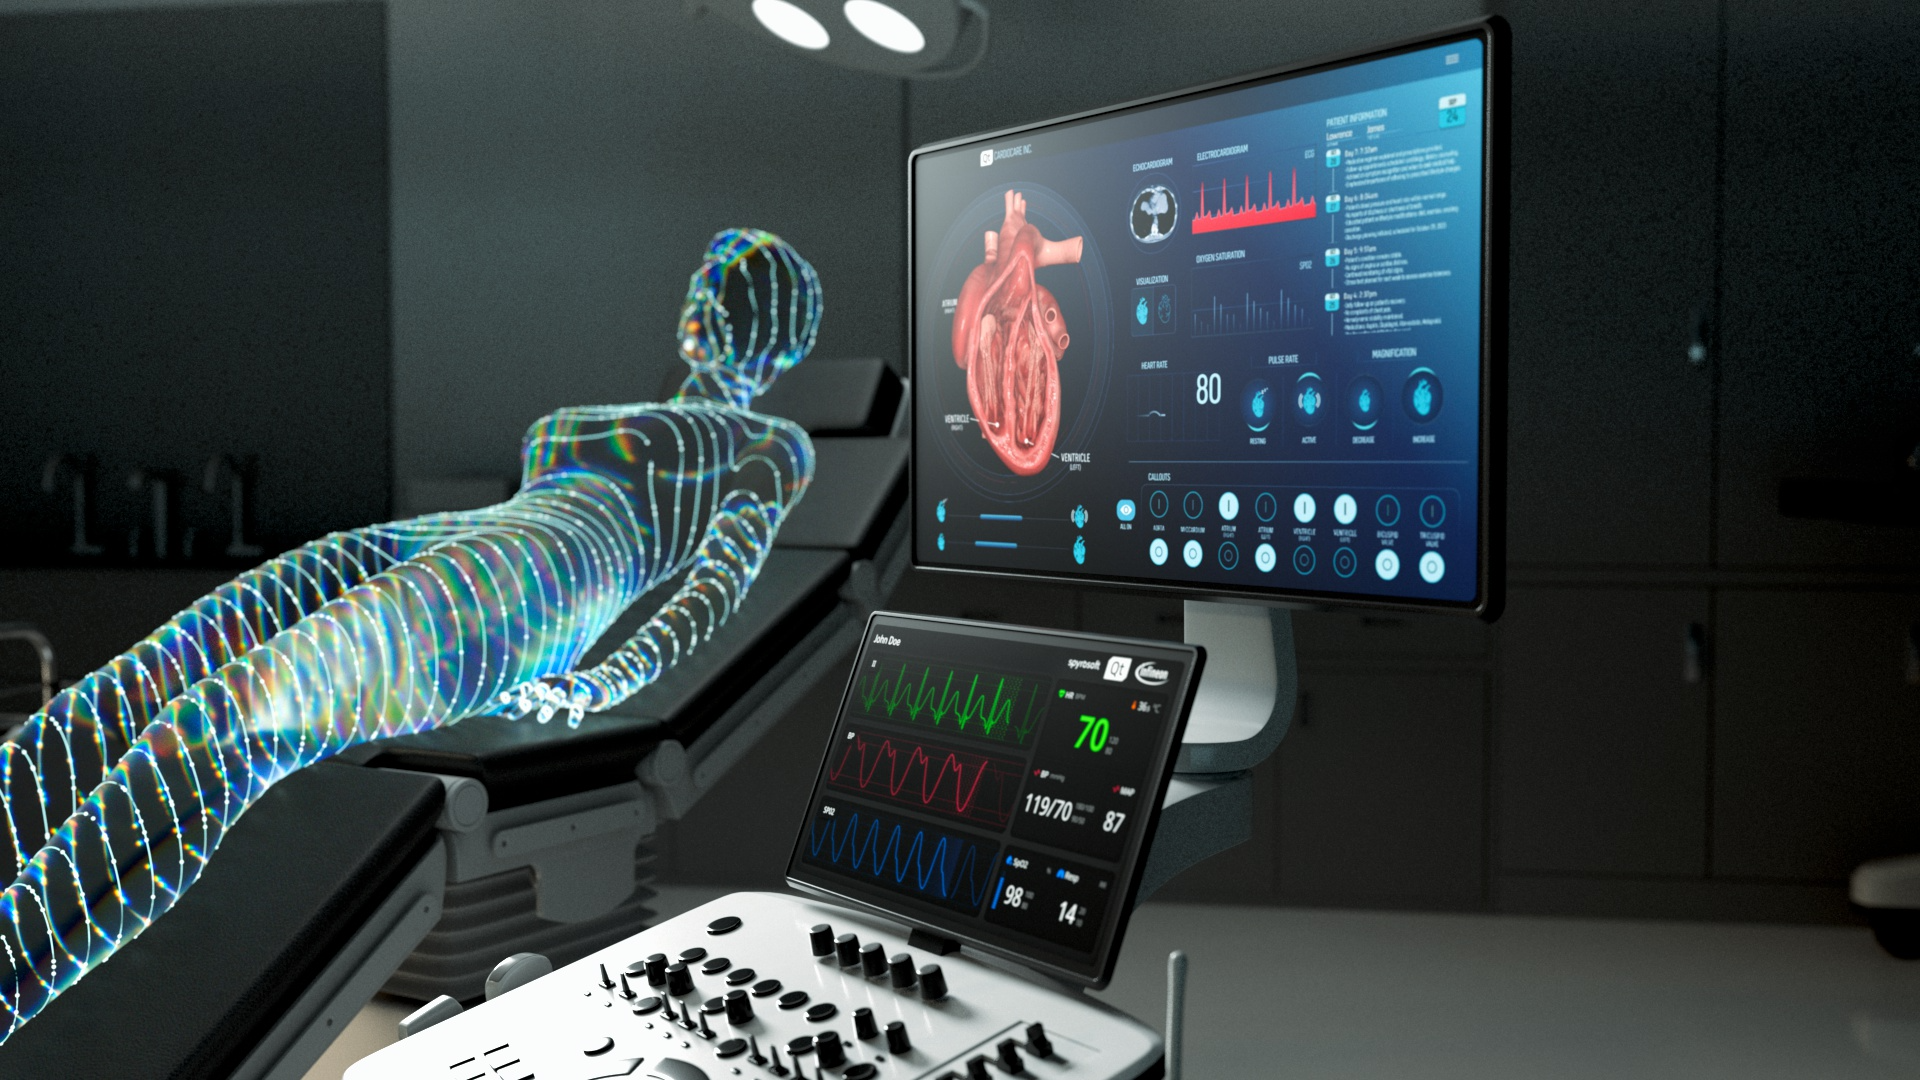
Blog: Qt for MedTech Pre- and Post-Market Surveillance
Once a regulated medical product is on the market, the US and EU require post-market surveillance. Post-Market Surveillance (PMS) is a systematic proc...
Read More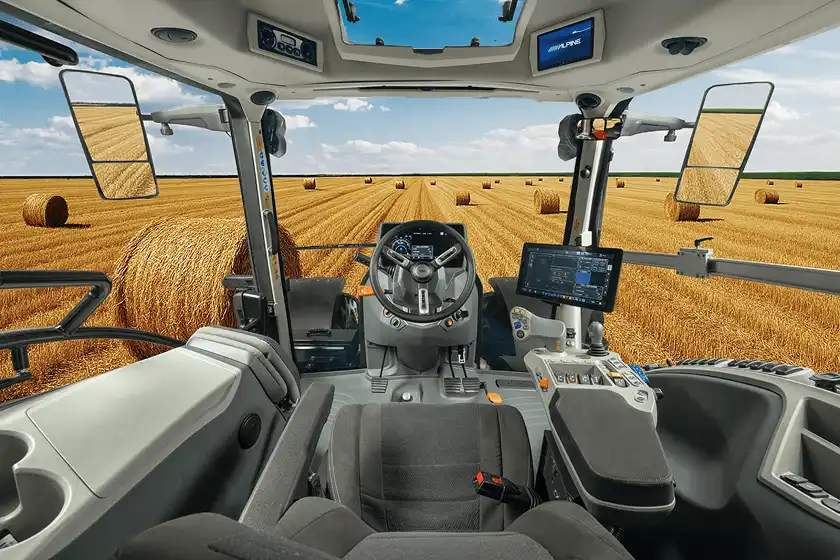
Argotractors | Built with Qt
Argo Tractors delivers smartphone-like user experiences to their tractors, while reducing development time by 40% thanks to Qt.
Read More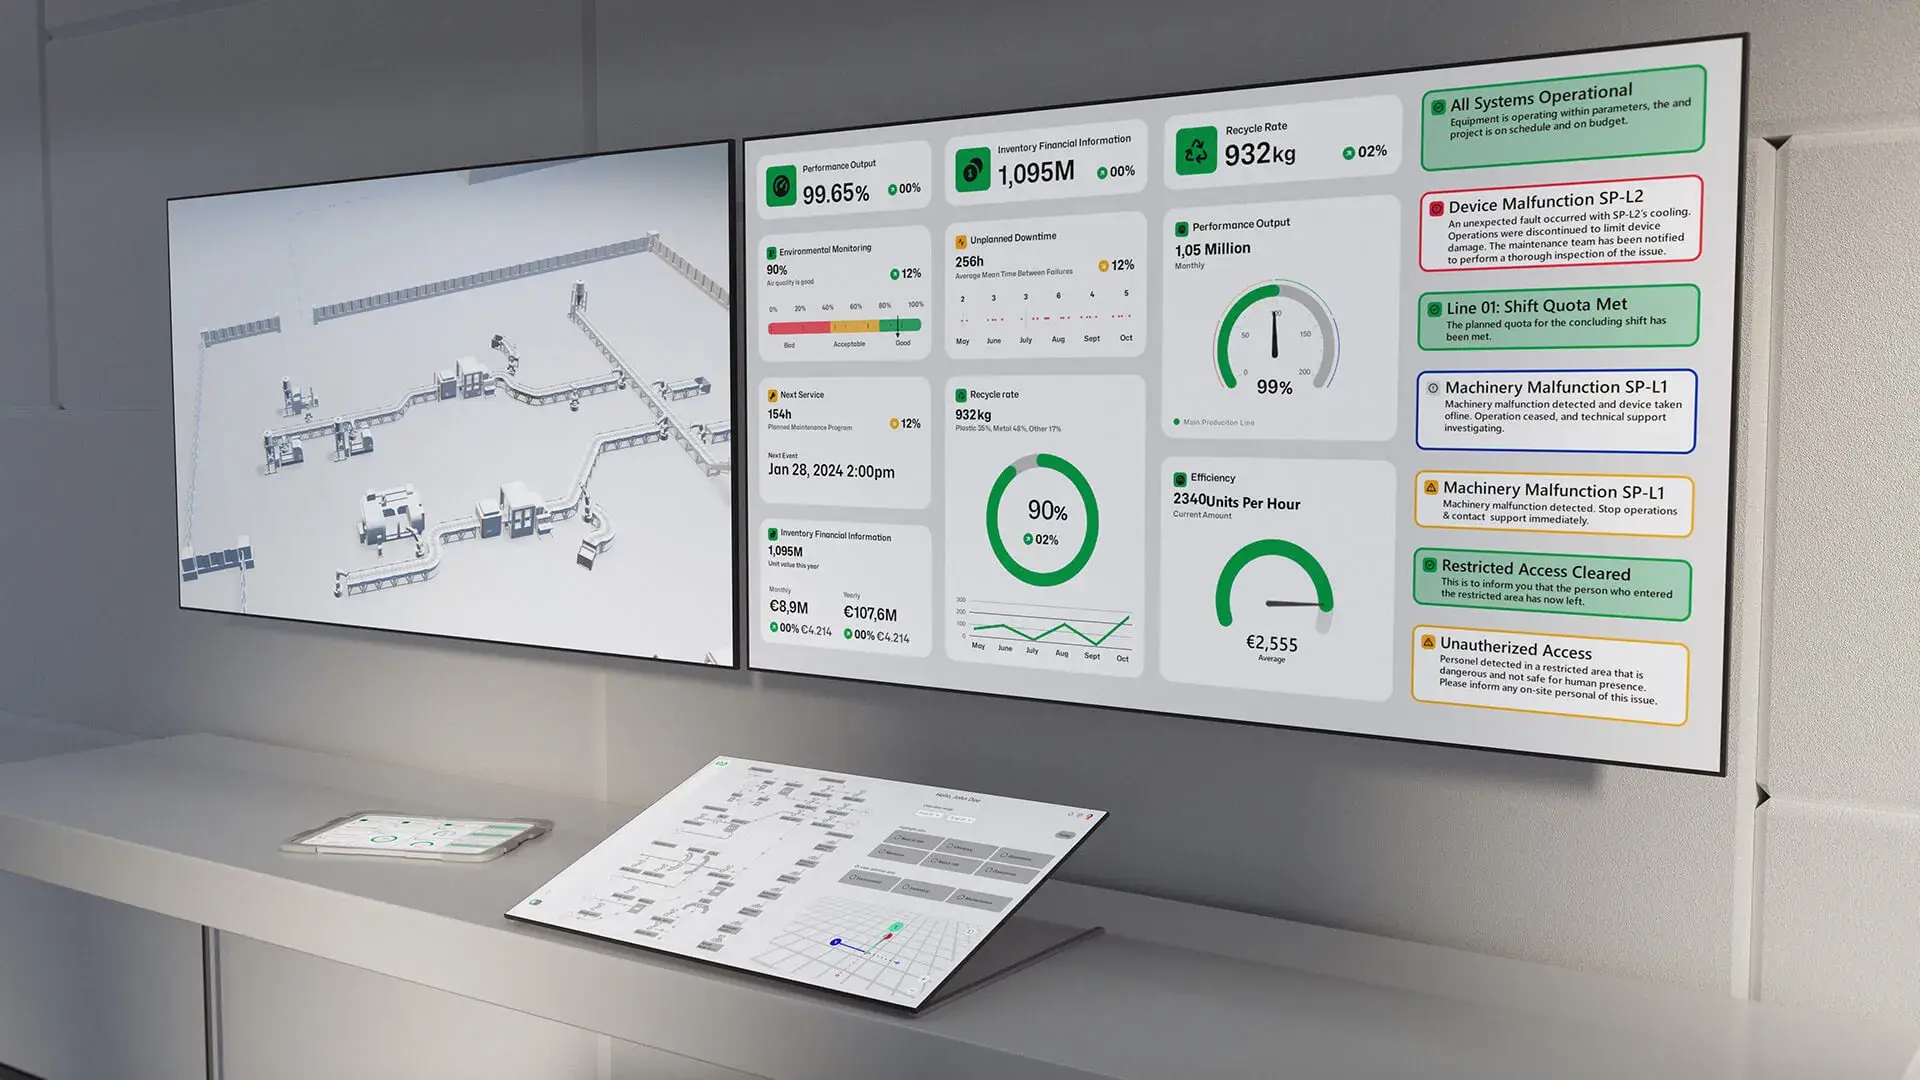
Blog: How to Modernize Legacy SCADA Apps
With too many Supervisory Control and Data Acquisition (SCADA) systems reliant on legacy frameworks like .NET or outdated MFC technology, today’s indu...
Read More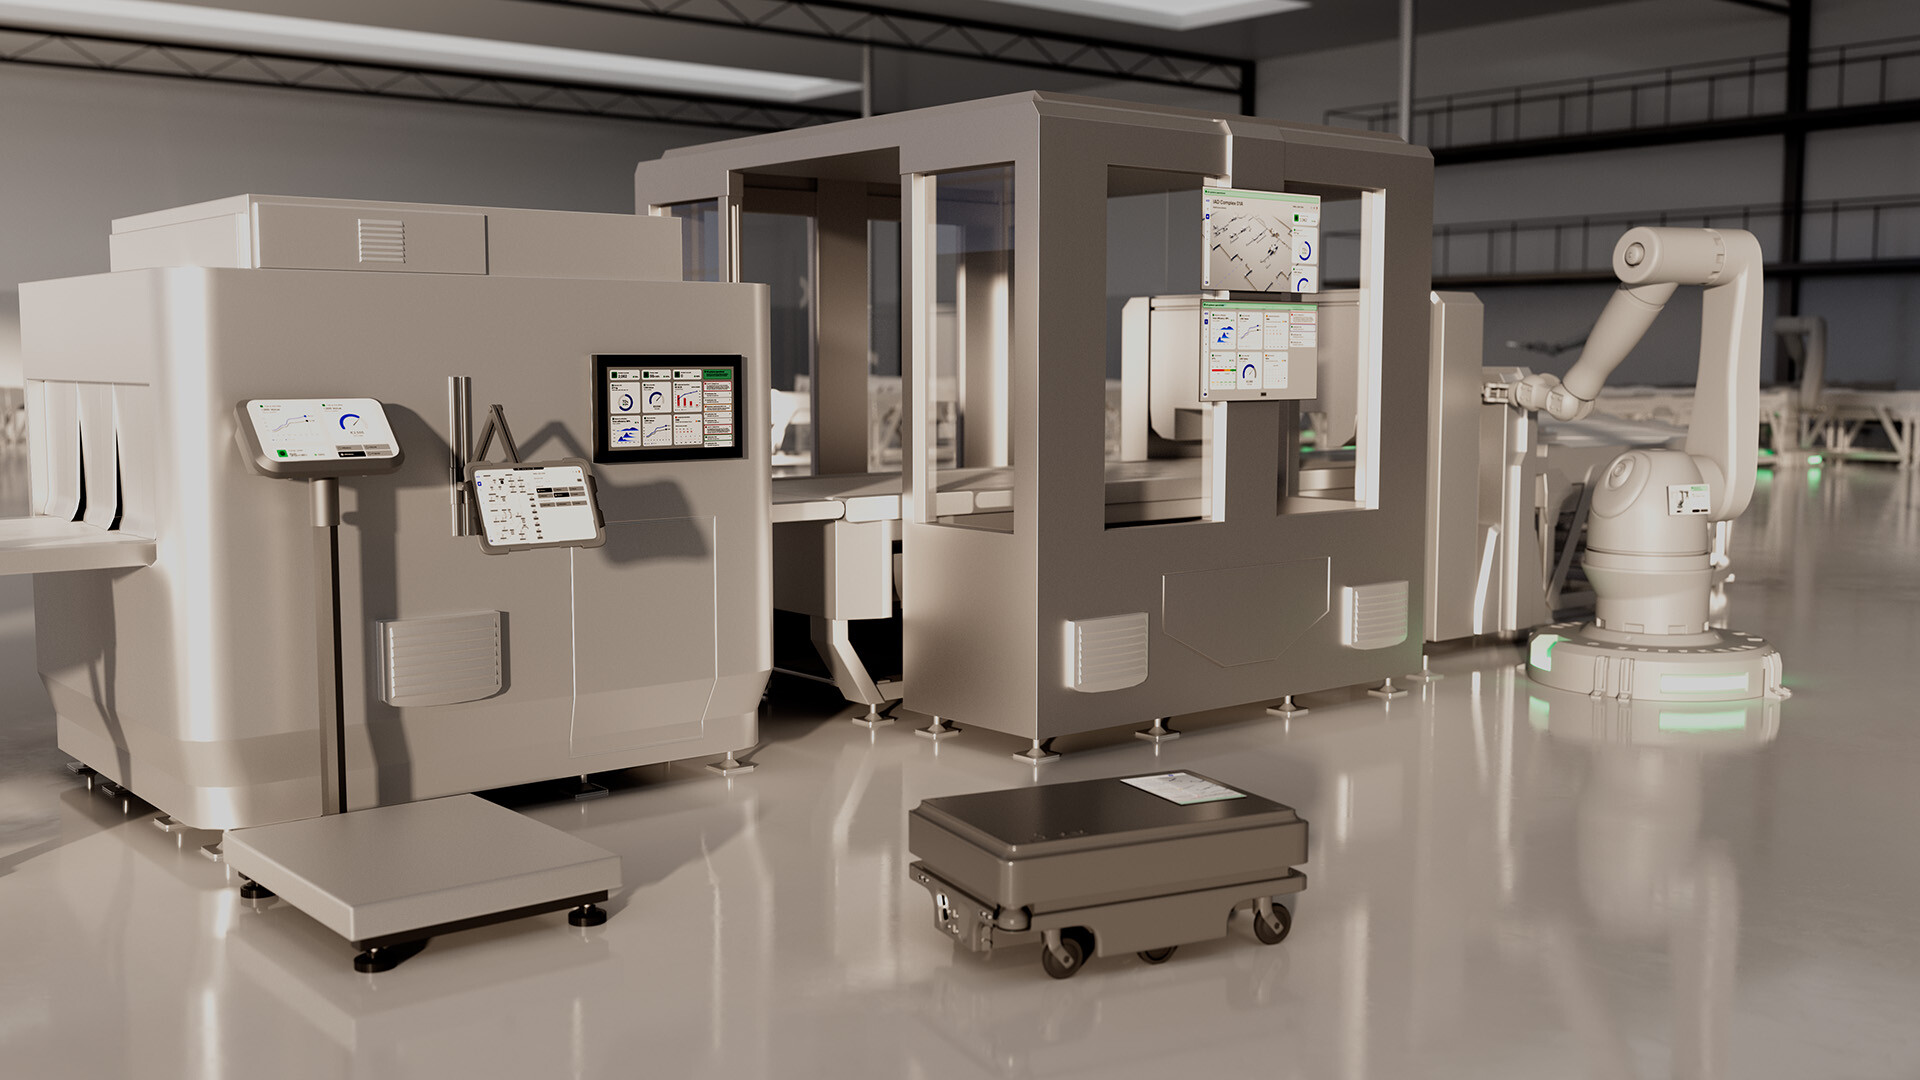
Blog: Built to Last: Five Best Practices for Building Reliable HMI
Your HMI architecture needs to stay reliable as technology evolves and user demands change. Short-term efficiency matters, but true success means desi...
Read More
Blog: Sandbox Solutions and Other Tools for Cyber-Securing Industrial Automation Software
Modern industrial environments are evolving, with connected IoT devices and integrated systems that drive operations, exposing traditionally isolated ...
Read More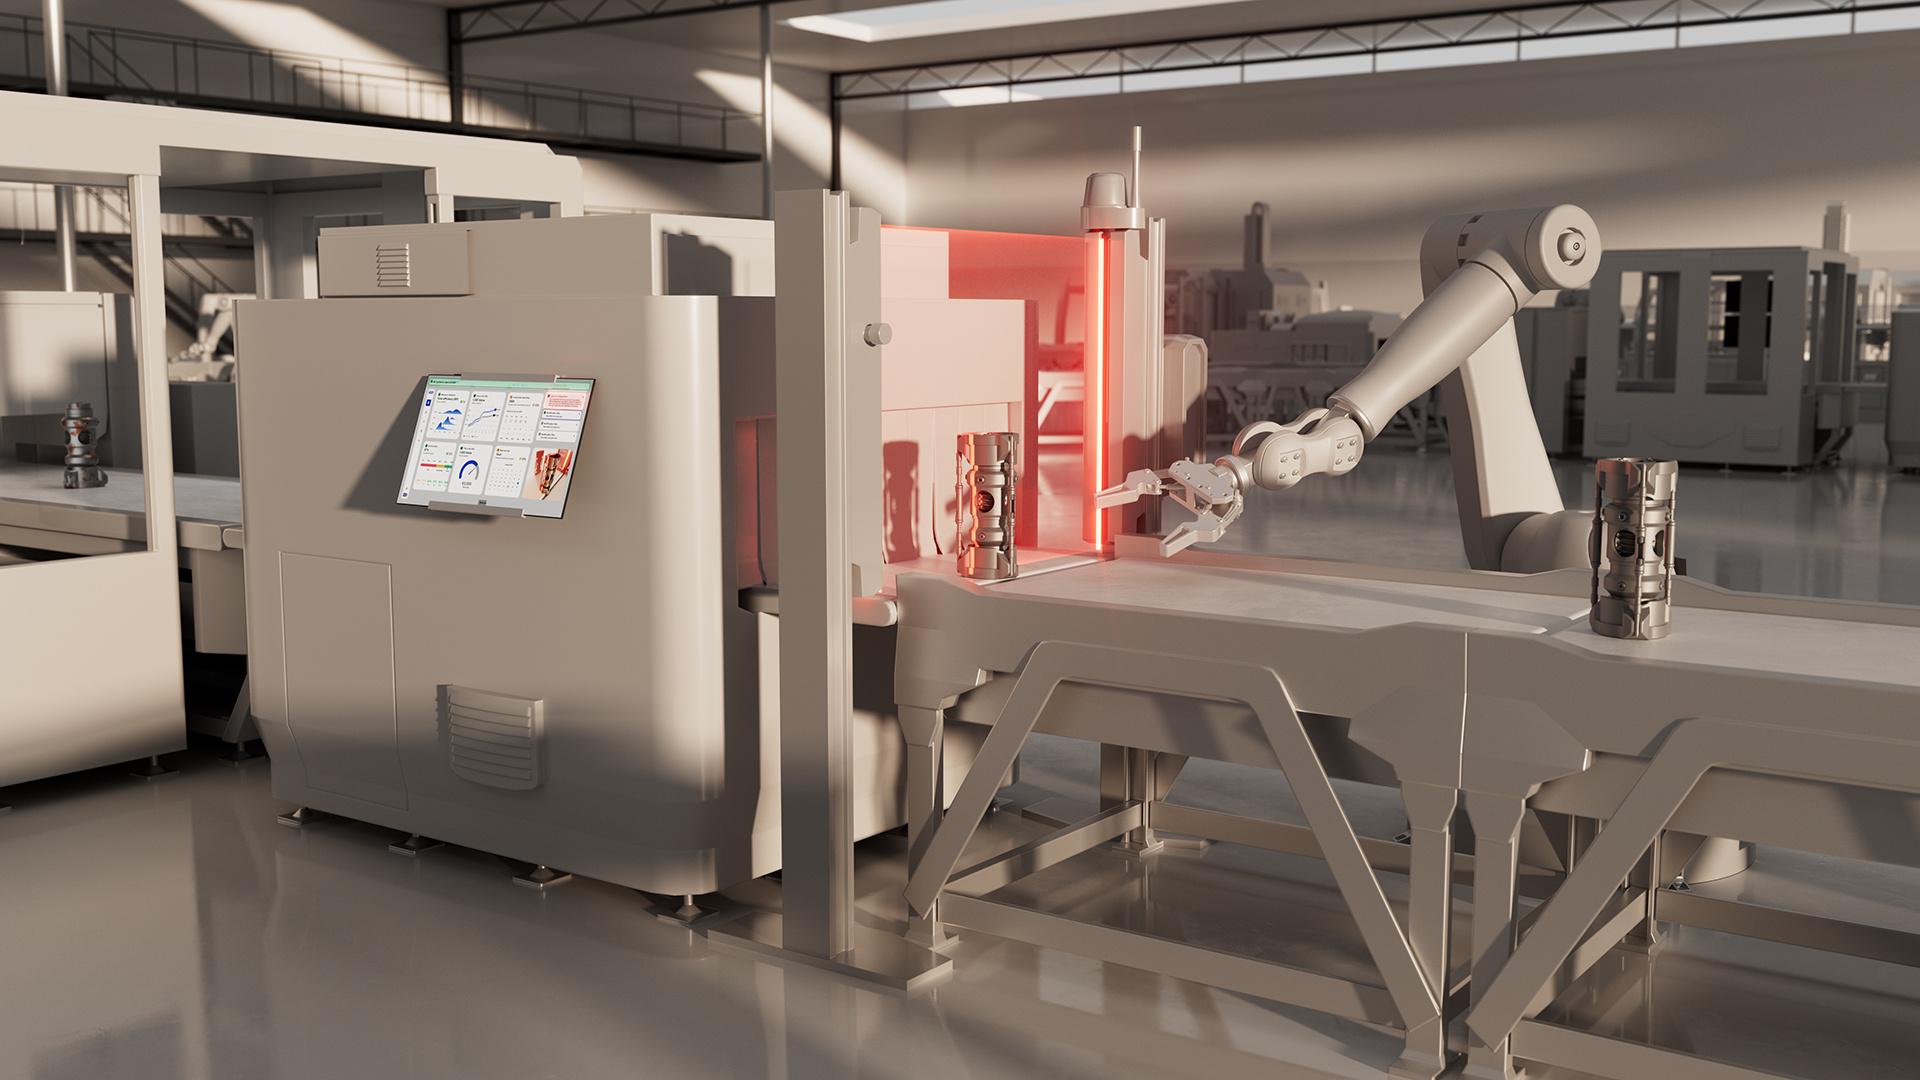
Blog: Sneak Peek: Exploring the Qt AI Inference API (Proof-of-Concept)
. The AI unified solution built with Qt seamlessly integrates multiple AI models into a cross-platform pipeline, leveraging the Qt Multimedia and Qt A...
Read More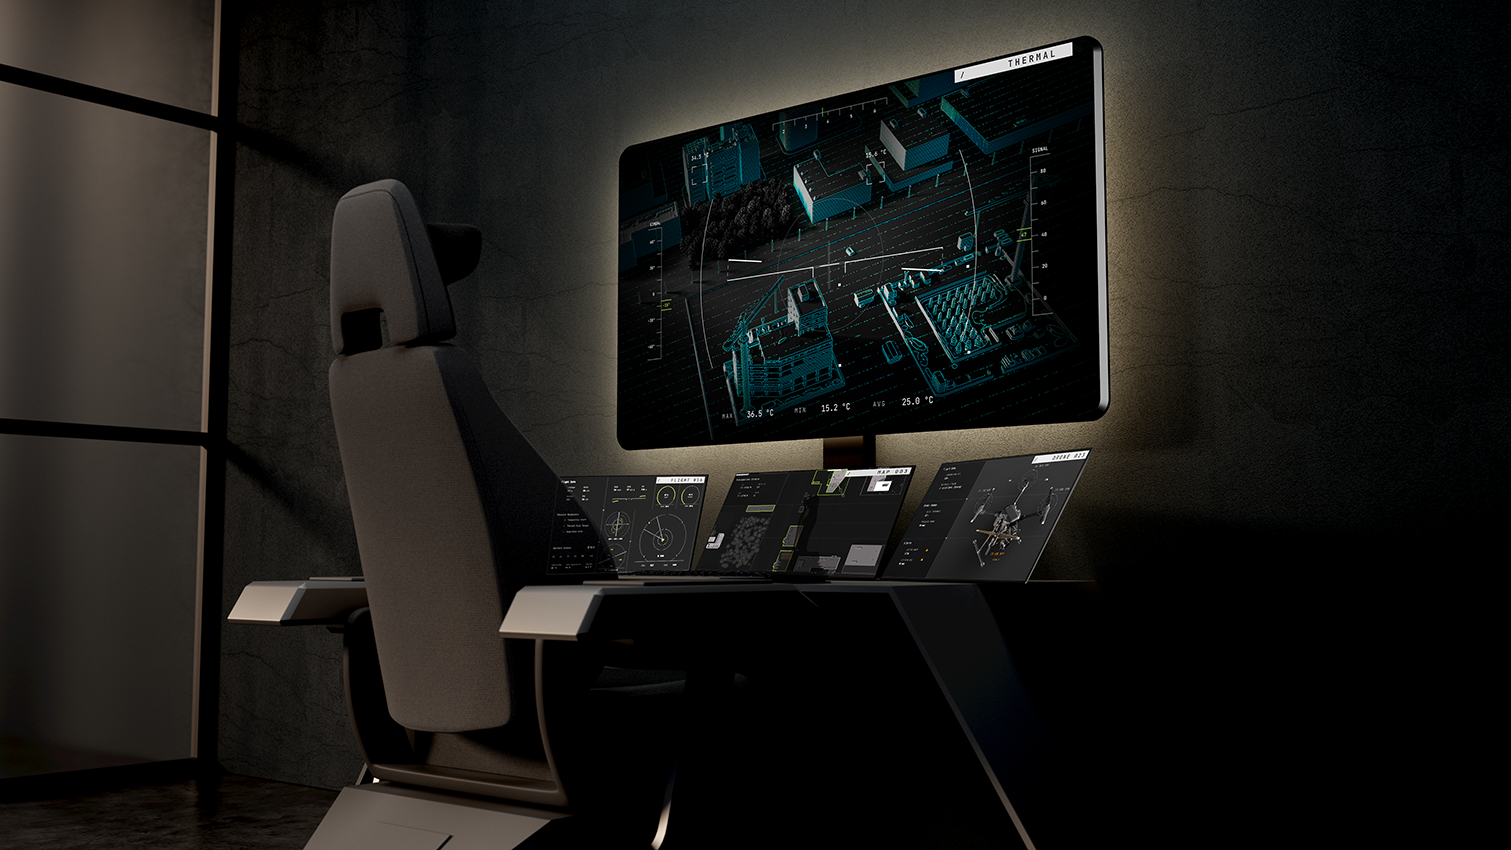
Blog: Efficiently Create Leading-Edge Aerospace and Defense Software with Qt
Qt Framework plays a critical role in powering a wide array of applications, ranging from drone ground control stations and radar systems to ground ve...
Read More
Blog: Qt for MOSA: FACE Conformant Qt for Aerospace and Defense Software
Qt Group launches Qt for MOSA: a FACE® Conformant version of Qt Framework empowering developers to create high-performance, feature-rich HMIs for miss...
Read More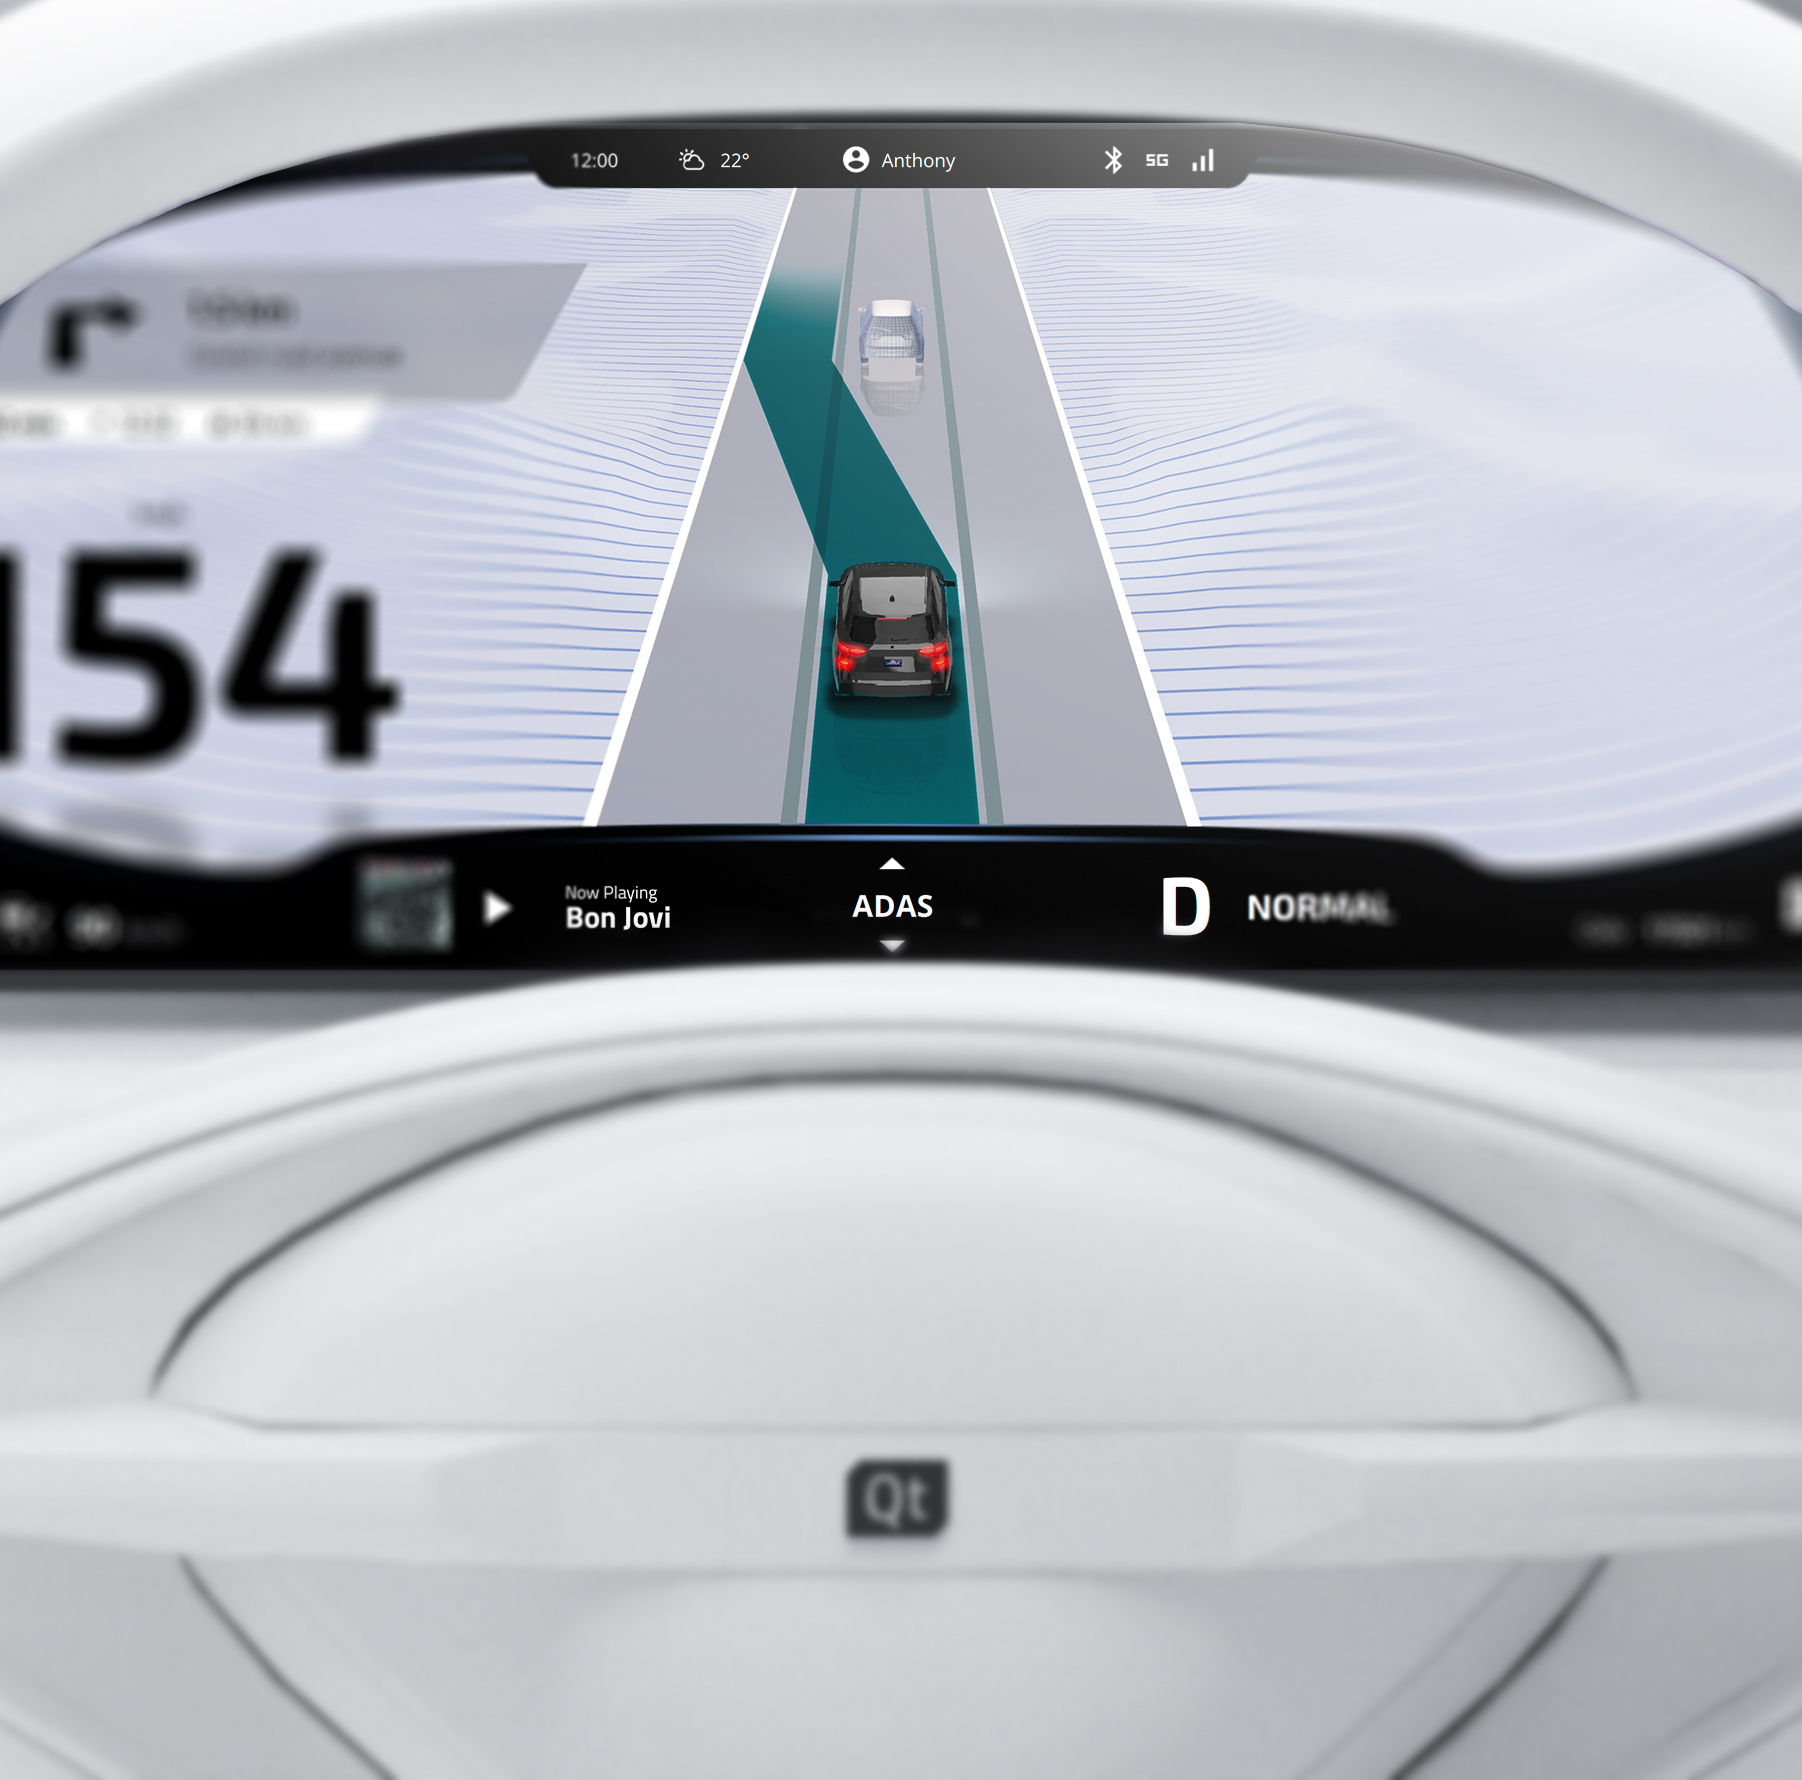
Article: Automotive HMI Frameworks: Driving UX for Software-Defined Vehicles
In software-defined vehicles, a robust automotive HMI framework serves as the foundation for delivering safe, consistent, and adaptable user experienc...
Read More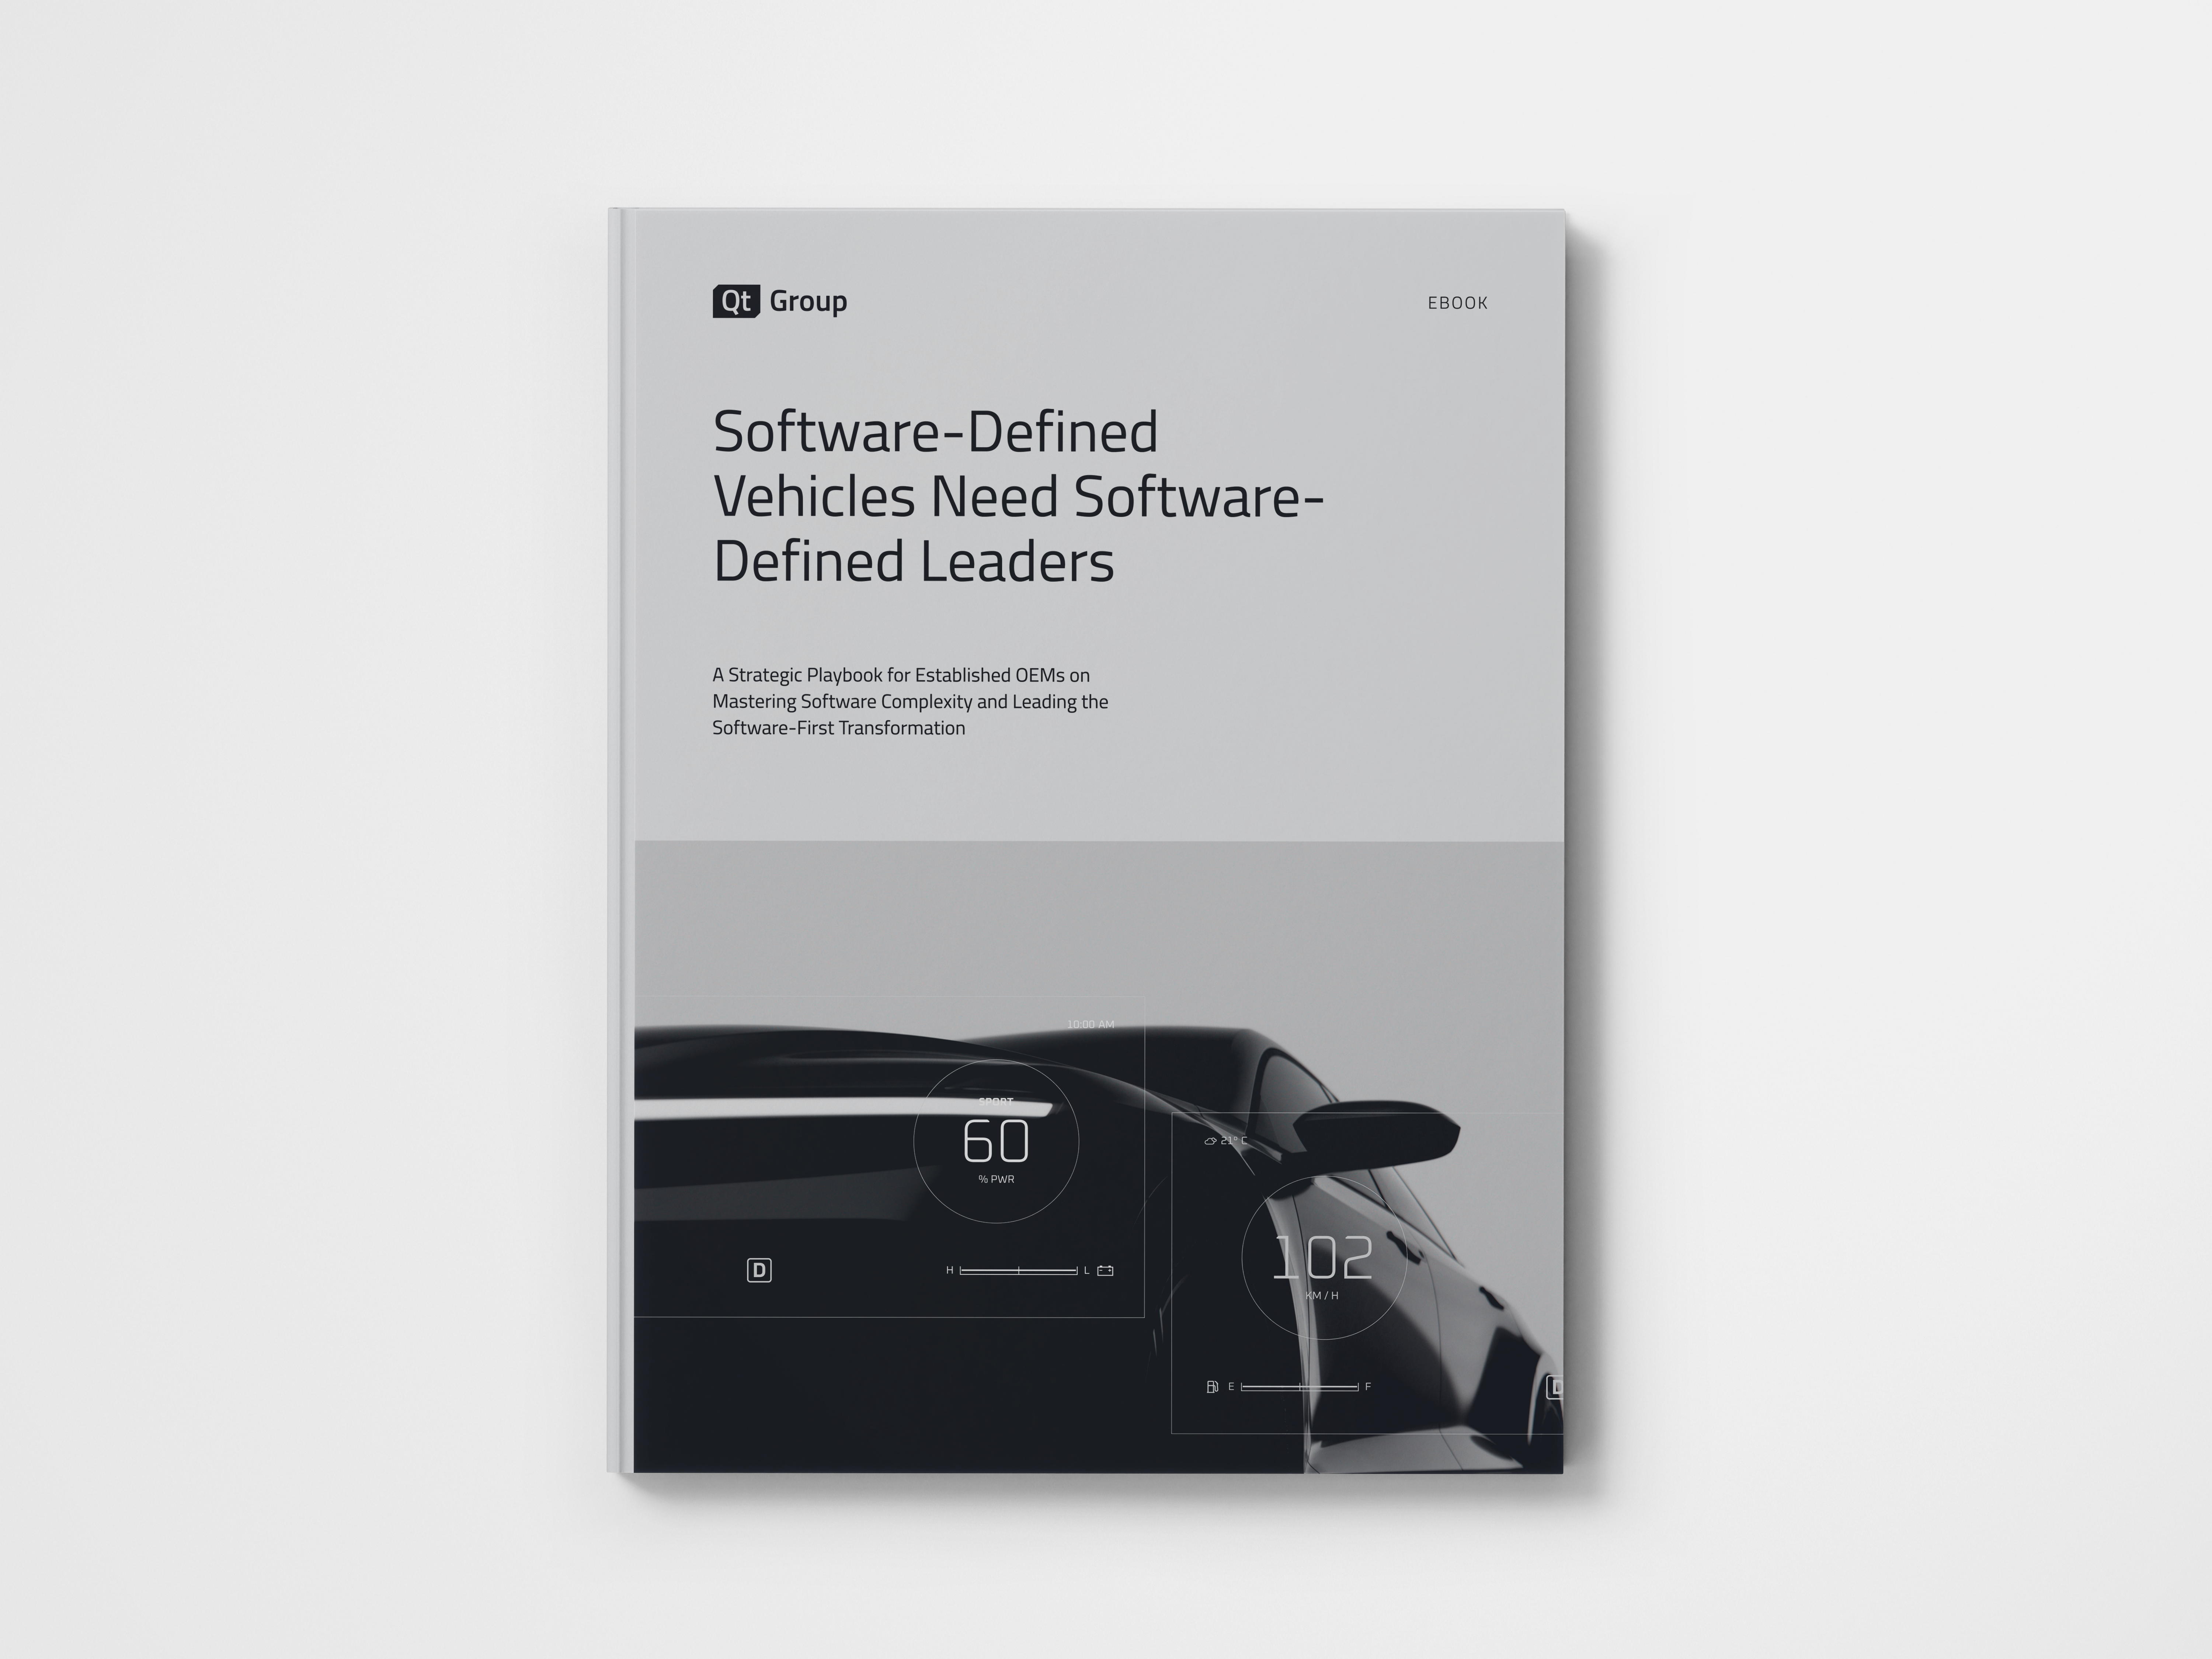
eBook: Software-Defined Vehicles Need Software-Defined Leaders
A strategic playbook for established OEMs tired of coping with complexity and ready to lead with a software-first mindset. You are delivering the soft...
Read More
Keurig | Built with Qt
Keurig's coffee machines provide a better brewing experience and cut development time with Qt Design Studio and Qt for MCUs.
Read More
Volkswagen | Built with Qt
Desay SV and Volkswagen have selected Qt and Vector to reduce memory consumption by 50% and deliver a superior experience on the 5-inch screen of the ...
Read More
Vision Paper: The EU Cyber Resilience Act - Are You Prepared?
Navigate the EU Cyber Resilience Act with Confidence. Understand the CRA, prepare strategically, and turn compliance into a strategic advantage. Free ...
Read More
CTE | Built with Qt
CTE (CTE TECH CORP.), a leading Taiwanese Tier 1 supplier, specializes in digital dashboard displays for a wide range of vehicle applications. By adop...
Read More
Verge | Built with Qt
Verge has built a superior riding experience on their electric motorcycles, reducing the memory footprint by 85%.
Read More
Article: How AI agents could make super apps viable in the West
Miao Luo, the Director of Technology Strategy, shares insights in The AI Journal on how AI agents could enable super apps to succeed in the West.
Read More
Oncosoft | Built with Qt
Oncosoft uses Qt to boost real-time 3D medical imaging and more than double development efficiency.
Read More
CrossControl | Built with Qt
CrossControl uses Qt to provide an instant-on experience on clusters and displays for heavy-duty vehicles in agriculture, construction, and more.
Read More
Kyungwoo | Built with Qt
Kyungwoo Systech partners with Qt Group to innovate Software Defined Off-Highway Vehicles, reducing development cycles by 50%.
Read More
Sauber | Built with Qt
Learn how Sauber uses Qt for rapid implementation of high-performance monitoring applications, pilot training, and advanced aerodynamic research.
Read More
Article: Customization vs Configuration: Striking a Balance for Embedded Software
How embedded software development can find the right balance between custom engineering solutions and standardized platform engineering approaches for...
Read More
Article: Laying Golden Paths: How Executives and Engineers Can Align on Platform Engineering
While platform engineering is widely seen as improving cost efficiency and productivity, companies cited various challenges in the Qt Group’s 2024 com...
Read More
Article: What Big Firms Can Learn from Smaller Teams about Platform Engineering
As embedded software teams scale globally, platform engineering becomes essential, but implementing internal development platforms and efficient workf...
Read More
Volven | Built with Qt
Volven is a Norwegian fintech company with over 25 years of experience in traditional finance. The company aims to create a high-performing crypto tra...
Read More
Roland | Built with Qt
Learn how Roland leverages Qt tools to create best-in-class products while decreasing development effort and verification time.
Read More
Article: The Critical Role of GUI Design for Safety, Efficiency, and Interoperability
Integrating new solutions with legacy systems remains a challenge in the industrial automation sector. This underscores the need for graphical user in...
Read More
Article: Cybersecurity for Industrial Vehicles: Risks and Solutions
As industrial vehicle automation and connectivity rise, so do cybersecurity risks. Fleet managers must identify threats and take preventative measures...
Read More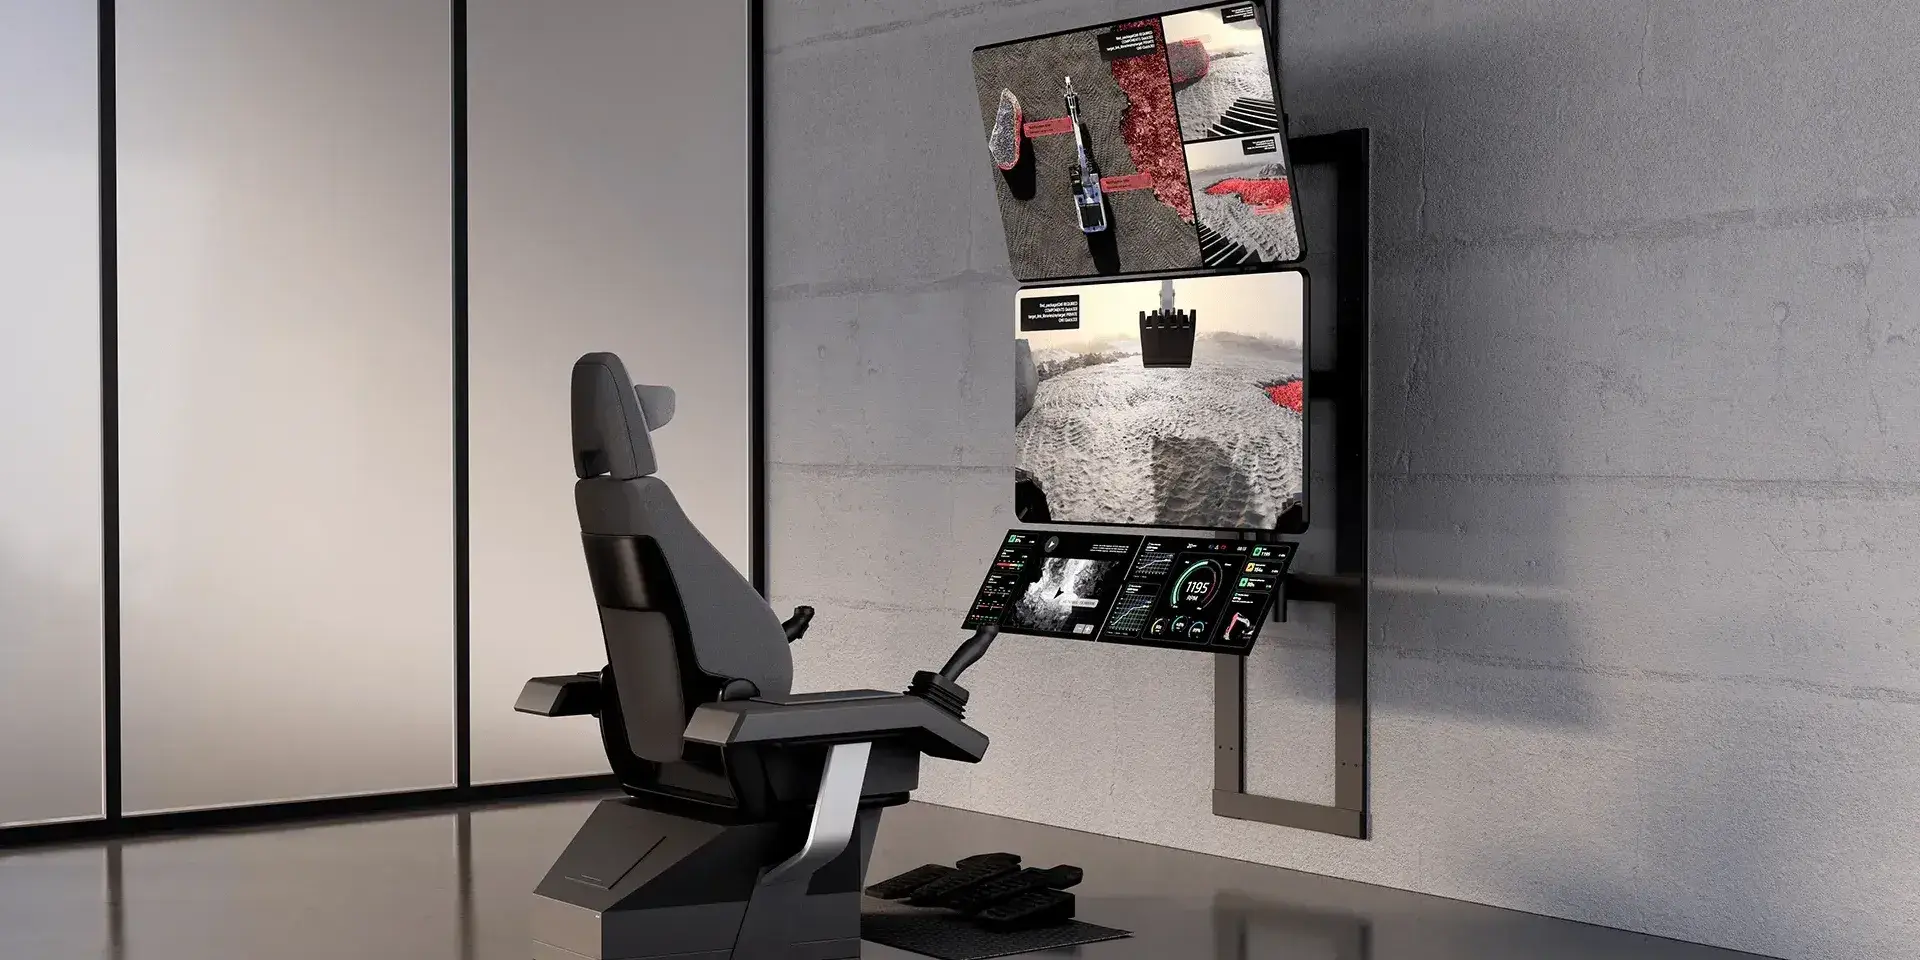
Article: Evolving the Workforce: User-Centric Design in Industrial Vehicles
User-centric design is transforming workers' interactions with industrial vehicles. By prioritizing intuitive interfaces and cross-functional collabor...
Read More
Article: Smart Vehicles Ahead: How Advanced Technologies are Shaping the Heavy-Duty Industry
Advanced technologies are transforming the design, development, and operations of heavy-duty vehicles across agriculture, construction, and heavy mach...
Read More
Article: Scaling Consumer Electronics: Challenges & Opportunities
Creating scalable consumer electronics products requires maintaining consistent user experiences and brand identity across various devices. One of the...
Read More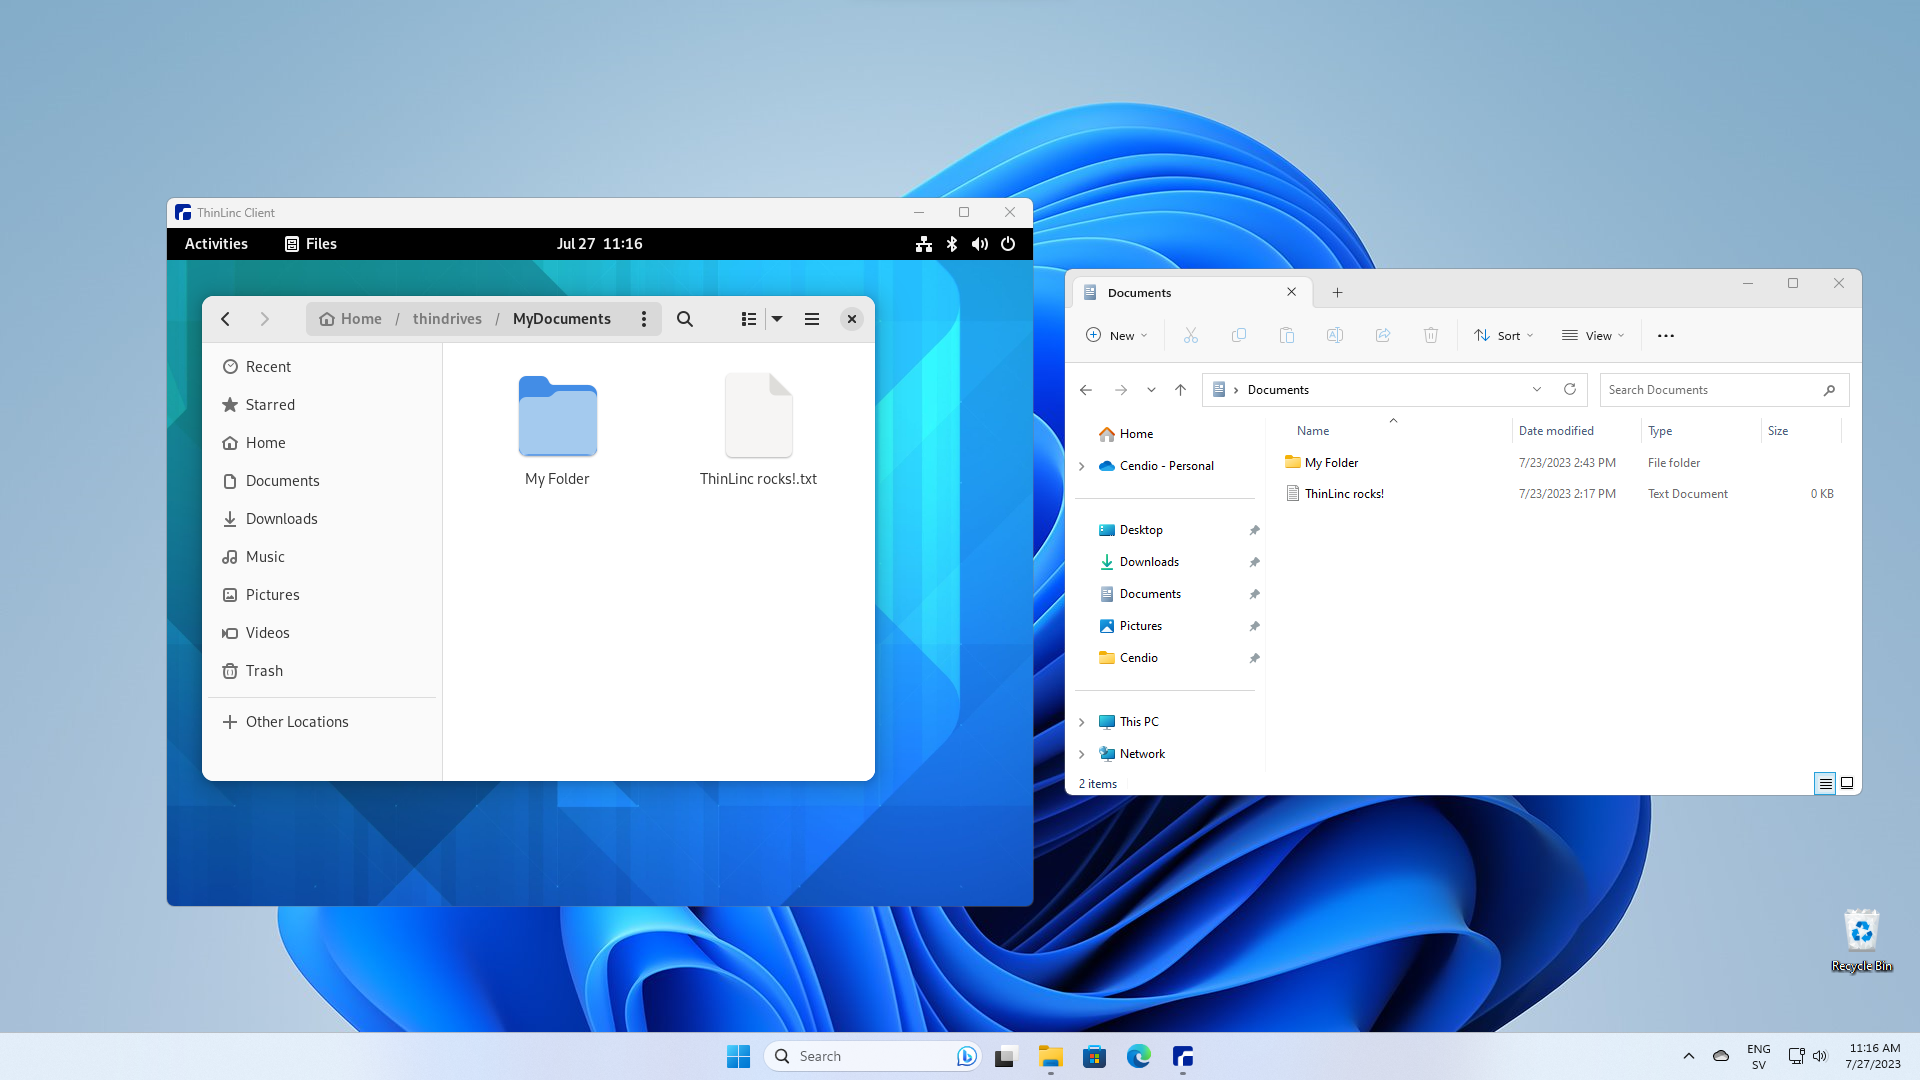
ThinLinc | Built with Qt
ThinLinc has undergone a major architectural upgrade, leveraging the Qt framework to bring in state-of-the-art functionality and look-and-feel.
Read More
Article: Acing MedTech With Regulatory Intelligence
An evolving regulatory environment has historically been a bottleneck for innovation in the MedTech industry. What problem areas and strategic methodo...
Read More
Article: A Prescription for Strengthening Healthcare Against Cyberattacks
The risk of cyberattacks is more significant than ever in healthcare. From advanced detection technologies to regulatory frameworks and collaborative ...
Read More
Article: Exploring the Potential and Limitations of Large Language Models
Large Language Models (LLMs) hold the potential to significantly enhance productivity in software development. But it's also crucial to remain aware o...
Read More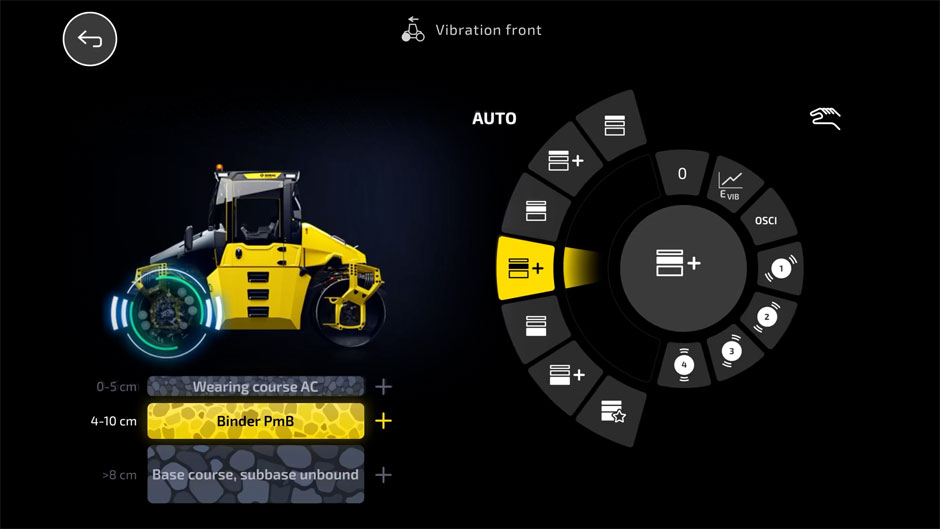
.png)
Article: Adapt or Fall Behind: Scalable Solutions Reshaping Manufacturing
From code reusability to decentralized control systems, scalable solutions are not just reshaping manufacturing automation; they're revolutionizing it...
Read More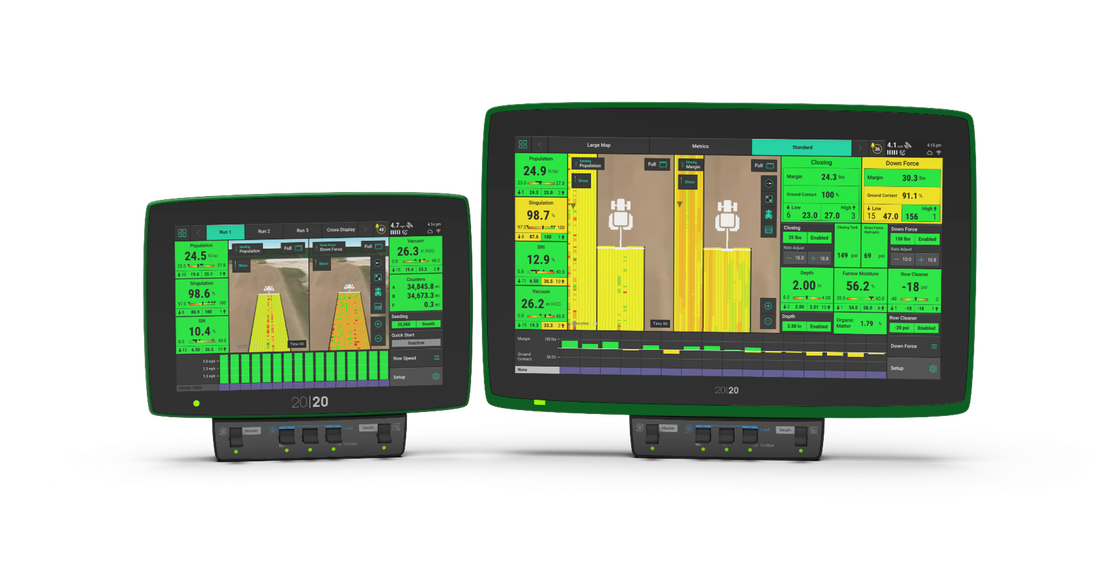
Precision Planting | Built with Qt
Precision Planting is a leading provider of agriculture technologies that upgrade a farmer’s existing planter, air seeder, drill, sprayer, liquid fert...
Read More
Blue Ctrl | Built with Qt
Blue Ctrl AS develops marine automation systems based on its comprehensive, state-of-the-art X-CONNECT® automation platform. Built entirely on the Qt ...
Read More
USEN-ALMEX | Built with Qt
USEN-ALMEX uses Qt to develop "Mynatouch," a card reader with face recognition that supports online qualification verification.
Read More
Article: Designing Tomorrow - Adopt Apple's Approach to Platform-Centric Standardization
How can you replicate the Apple experience across your products? Central to this challenge is the transition from platform-centric to ecosystem-centri...
Read More
Article: 5 Critical Steps to Enhance UX for Connected Devices
In the age of the Internet of Things (IoT), devices are designed to simplify our lives, improve efficiency, and enhance our overall user experience (U...
Read More
Article: Mastering Composable Architecture: 5 Tips for Success
Master composable architecture with our top 5 tips for streamlined, modular application development. Elevate your coding skills with Qt's expert guide...
Read More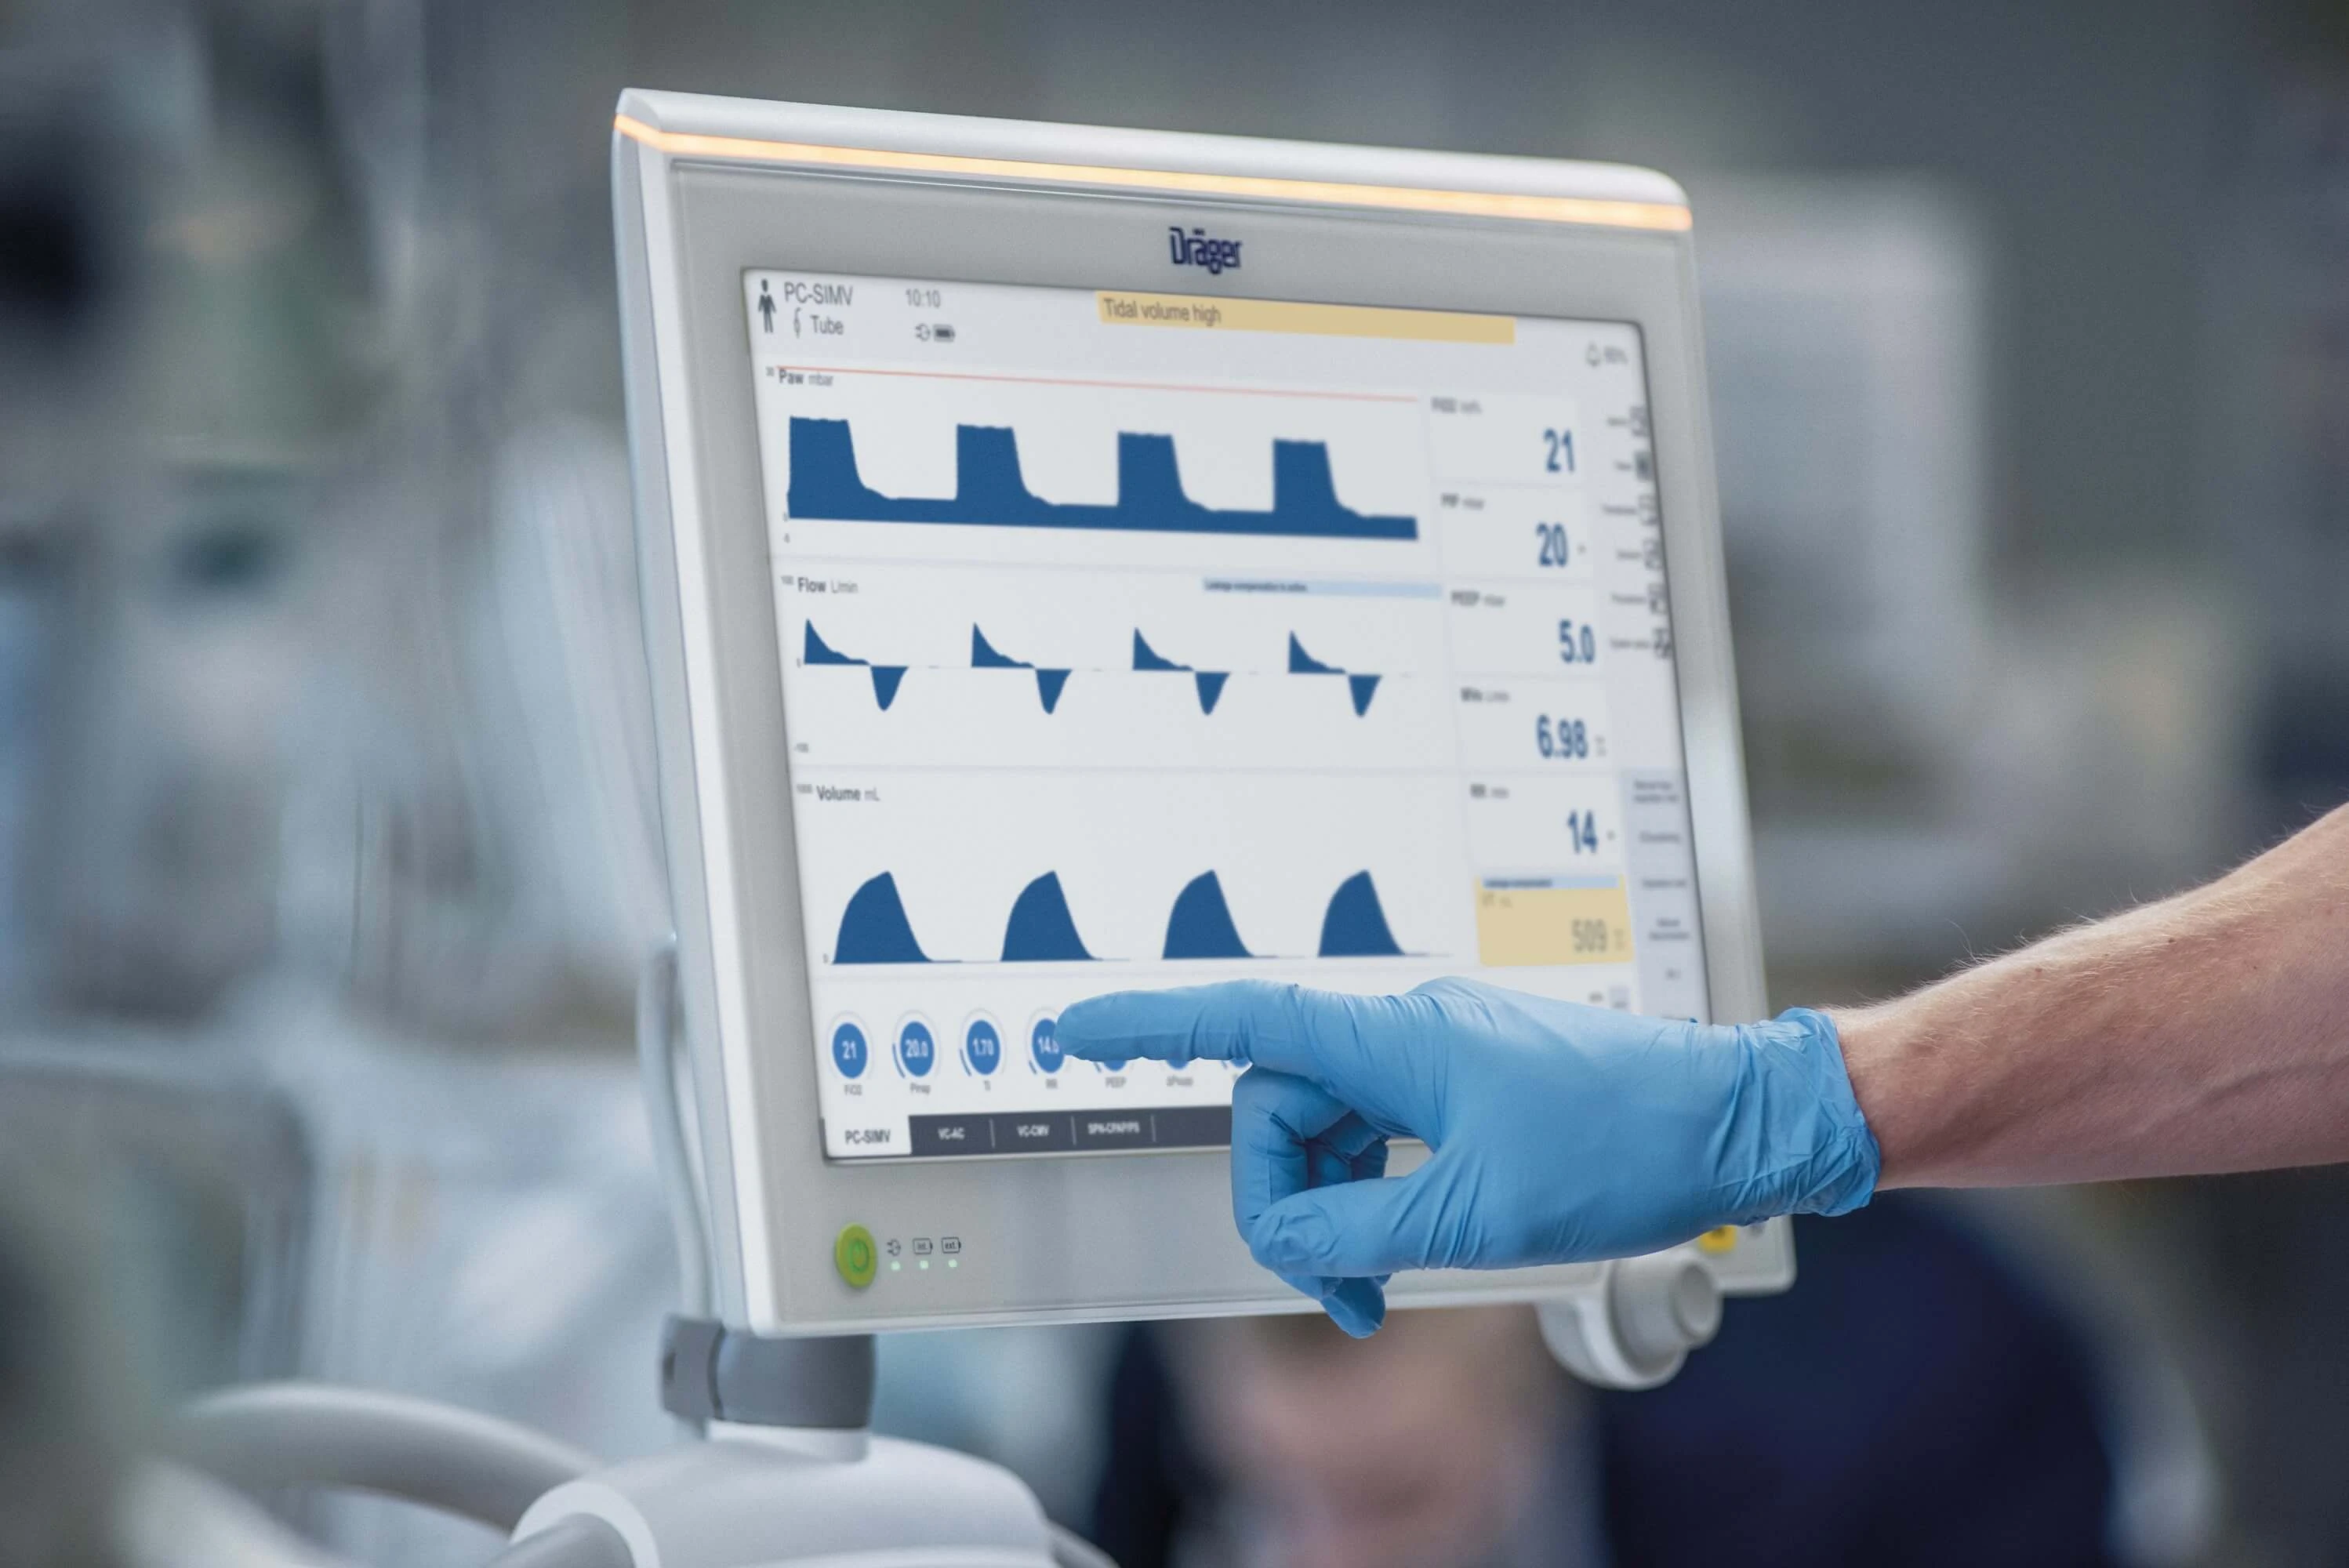


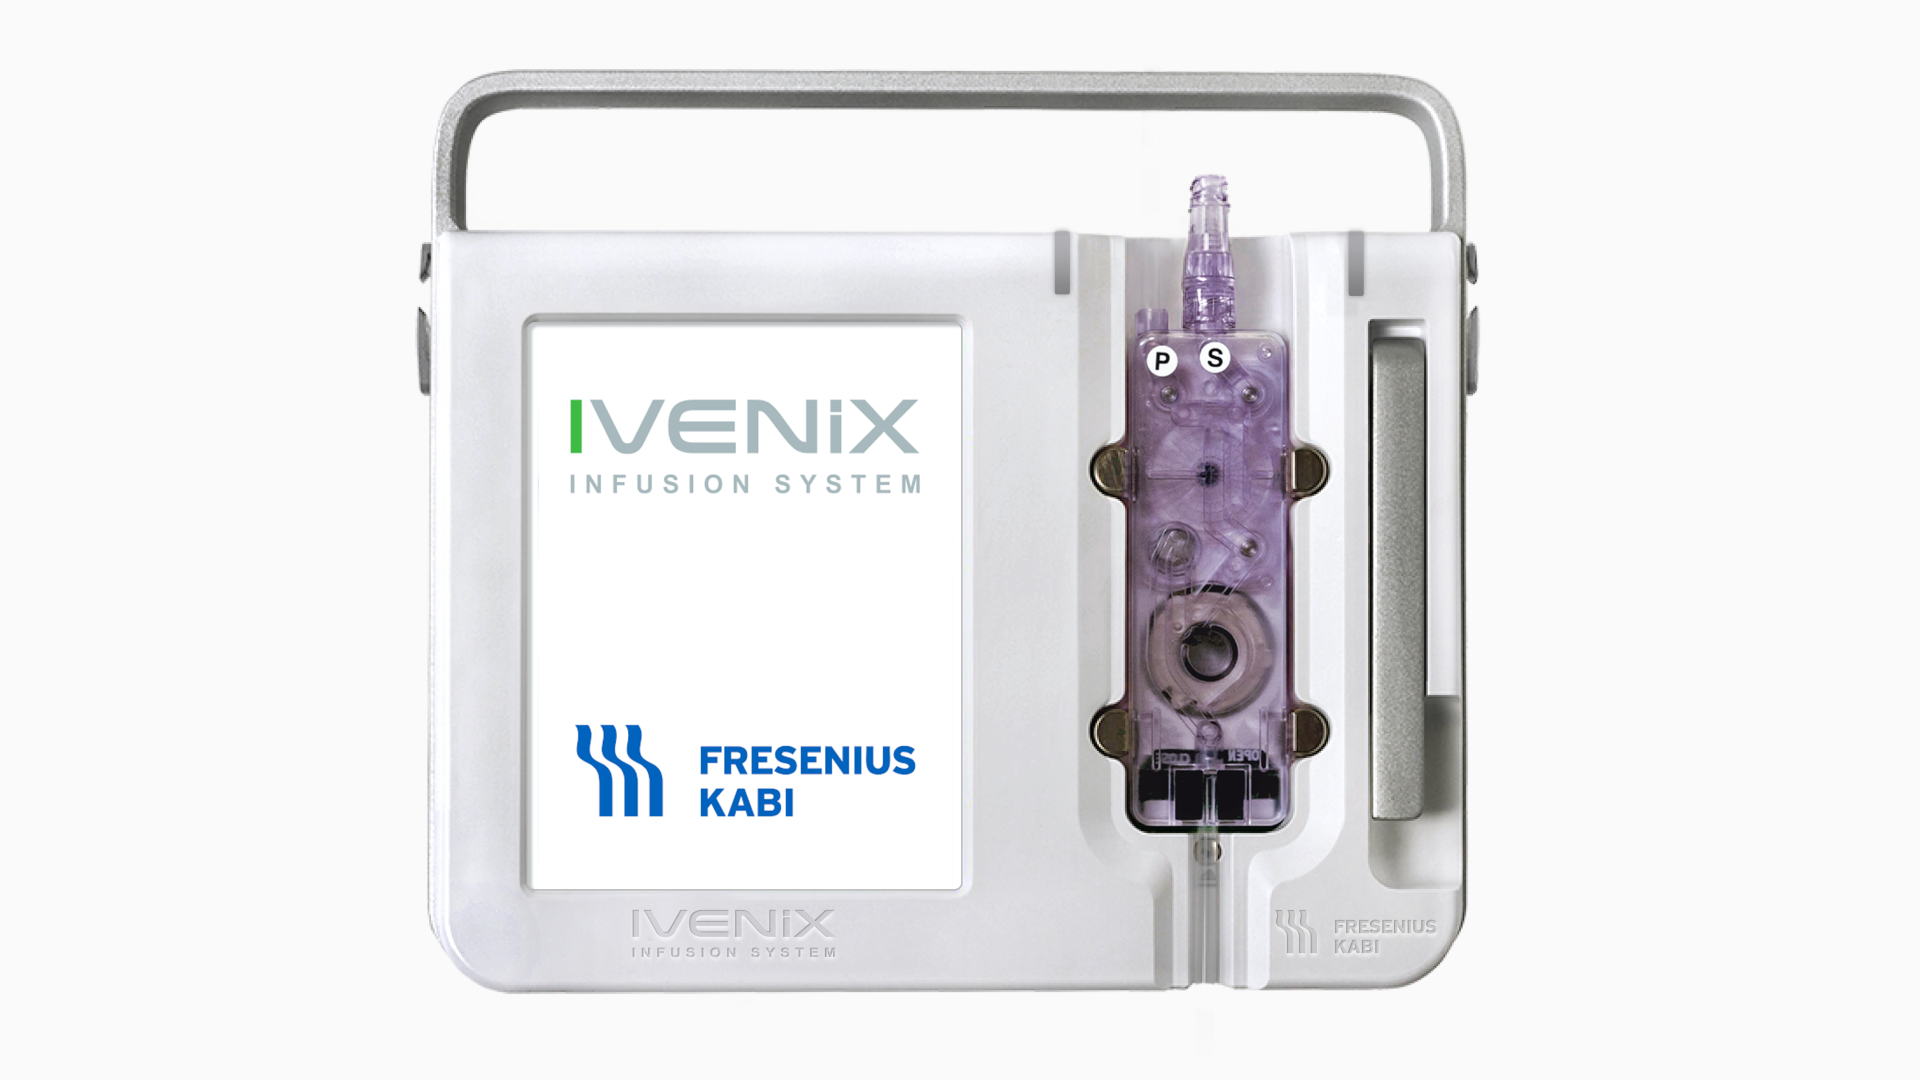

Article: How to Boost Productivity While Managing Technical Debt
Uncover practical strategies to enhance productivity in software development by managing technical debt, meet evolving user expectations, and industry...
Read More
Hasselblad - Built with Qt
A recent example of Hasselblad's technical leadership is the new medium format camera X2D 100C, which uses Qt on all its displays, including Qt for MC...
Read More
ArcGIS Maps SDK for Qt | Built with Qt
Esri is the global market leader in Geographic Information System (GIS) software, location intelligence, and mapping. Read their customer story here.
Read More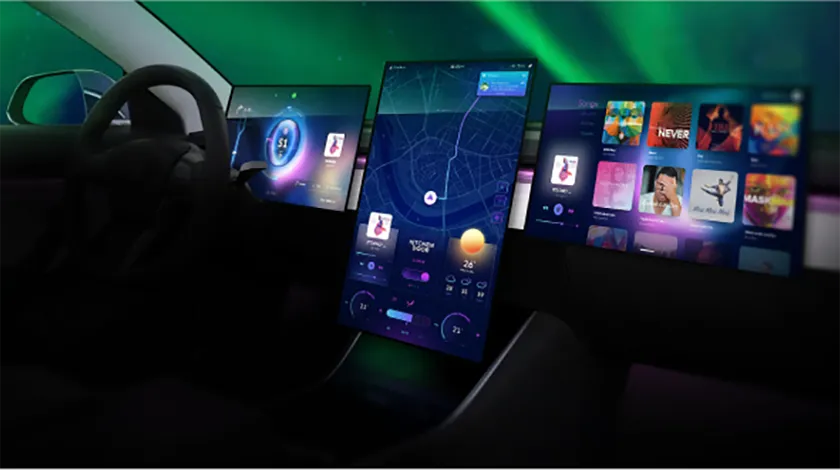
Article: Enhancing Automotive UX and HMI Design through Digital Transformation
Digital UX and HMI design are crucial for enhancing the driving experience as the automotive industry evolves. Discover how they are reshaping the int...
Read More
Gruppo Cimbali | Built with Qt
The Qt framework powers La Cimbali's Model S digital display.
Read More.webp)
S3 Fuzion's Xelorate | Built with Qt
Stop searching, start finding with S3 Fuzion's Xelorate.
Read More%20copy.jpg)

Article: Designing for Efficiency: UX Solutions for Industrial Automation
Boost industrial automation efficiency with UX solutions. Learn how in this expert article from Qt.
Read More
Article: Stay Ahead in Turbulent Times: Unlock the Power of User-Centric UX/UI
Explore the impact of macroeconomic challenges on UI/UX innovation in the embedded systems market. Learn about strong investment in XR, ML, and hyper-...
Read More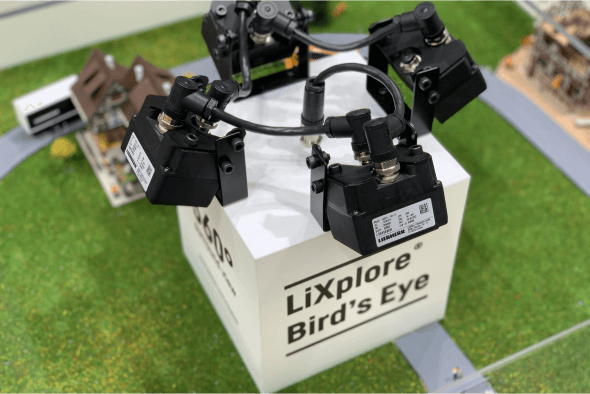
Liebherr-Electronics and Drives GmbH - Built with Qt
Qt's framework and components power Liebherr-Elektronik GmbH's Bird's eye and CMS (camera-monitor system) applications.
Read More
RGNT Motorcycles - Built with Qt
RGNT chose Qt as it offers so many effective out-of-the-box solutions for these purposes. In less than a year, a small team of developers was able to ...
Read More
Article: Saving Lives with UX Design
Read why UX's importance in healthcare is growing rapidly and why it's life-saving to pay attention to. Take a look!
Read More
Article: Rethinking UX for the Consumer-Centric Era
This article covers why companies need to level up their UX investments and ensure they are in sync with user behavior in consumer electronics industr...
Read More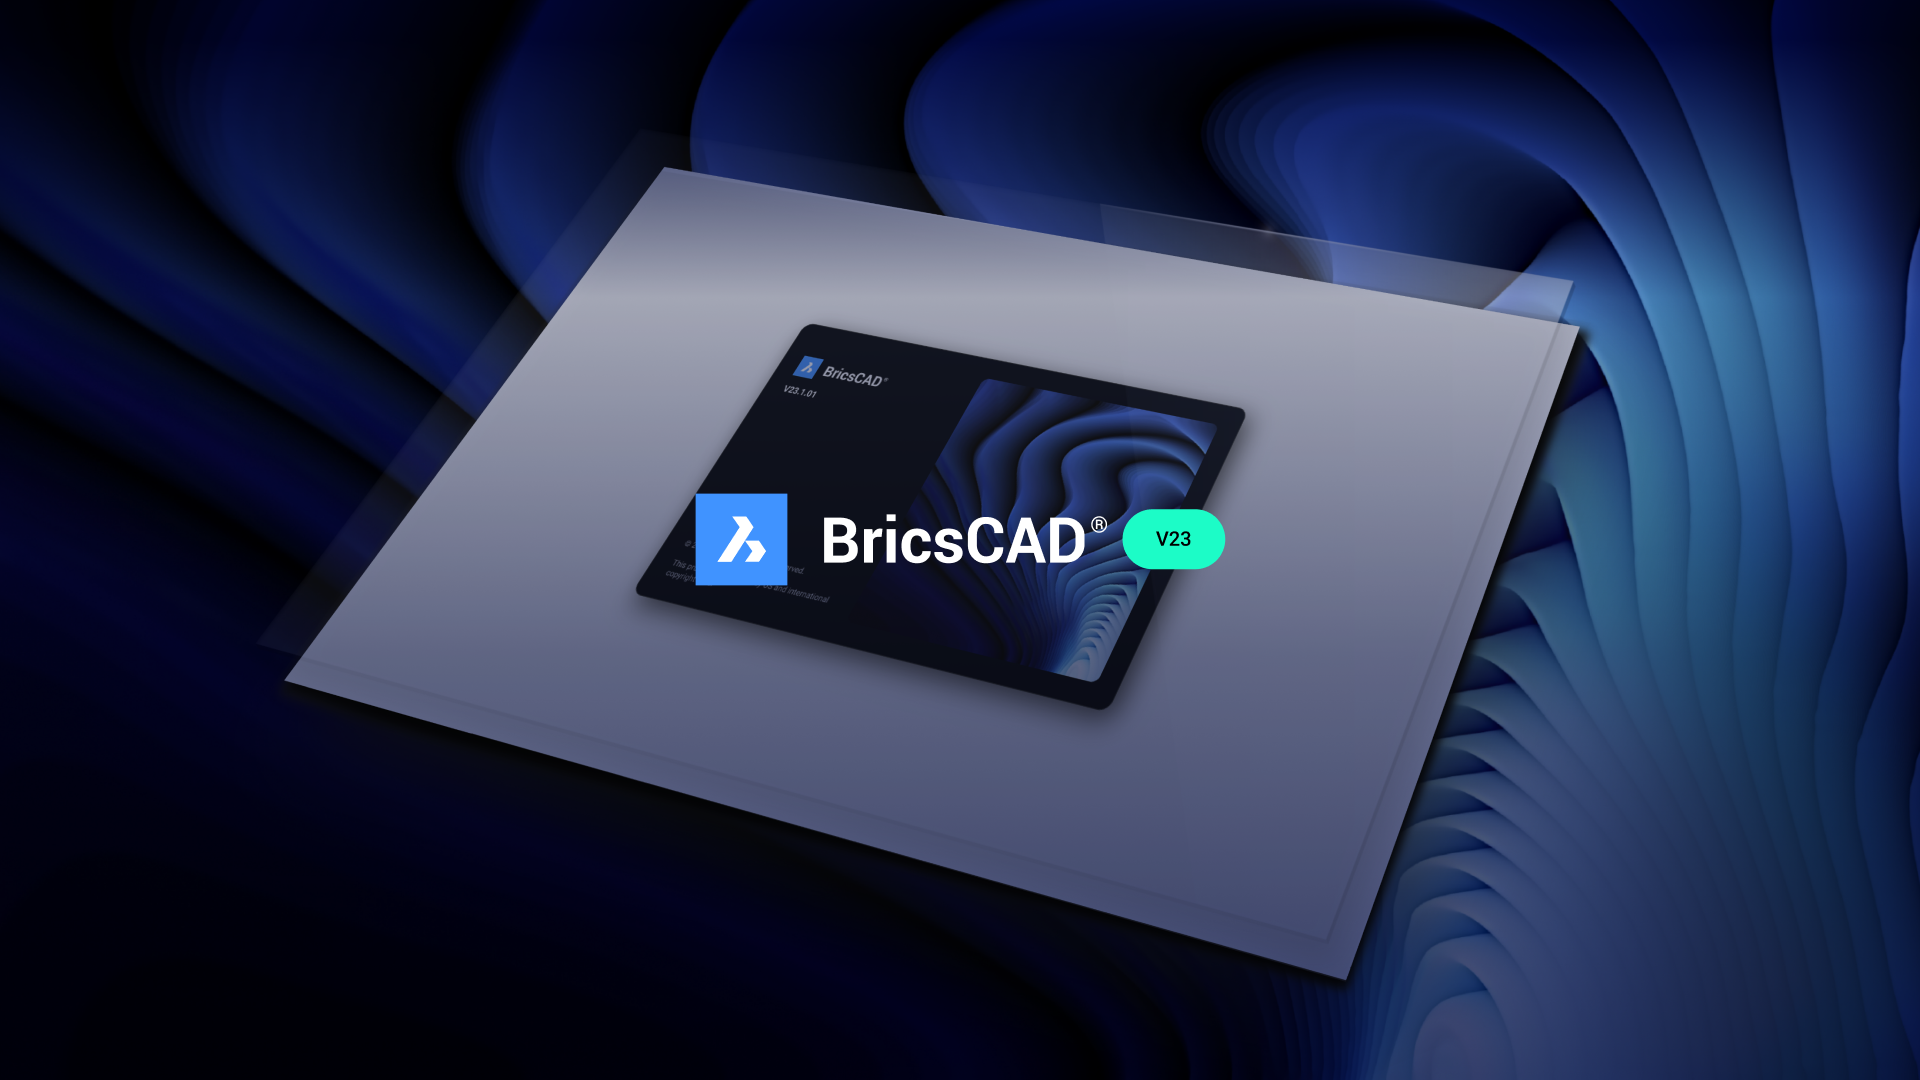
Bricsys | Built with Qt
Bricsys is a global provider of the BricsCAD® brand of engineering design software. Learn about their journey and successes using Qt.
Read More
EM Microelectronic - Built with Qt
EM Microelectronic (Swatch Group) partners with Qt Group to leverage the advanced UI capabilities offered by the Qt framework for the creation of thei...
Read More
AirServer – Universal Screen Mirroring Receiver Built with Qt
AirServer is a cross-platform screen mirroring solution that allows you to project from any Apple, Google or Microsoft device to any TV, monitor or pr...
Read More
AMD – Graphics software
Computing and graphics powerhouse AMD uses Qt in development of its Radeon Software Crimson Edition graphics package.
Read More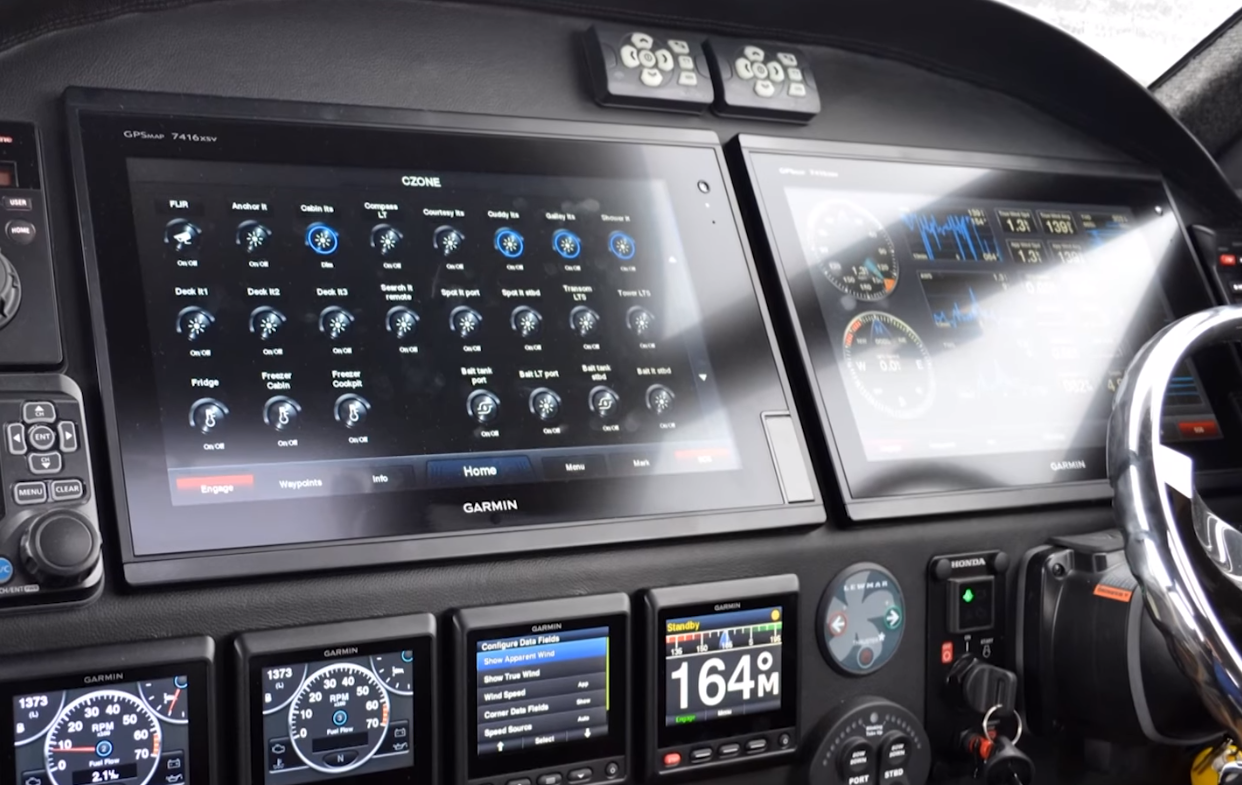
BEP Marine – Marine Automation Systems
BEP Marine chooses Qt to empower agile development and create user interfaces for their CZone system.
Read More
LG – Electronic Smart TVs
LG’s innovative technologies, unique products, and cutting-edge designs are built with Qt.x
Read More
Medec – Anesthesia & Critical Care Medical Devices
Qt-based anesthesia & critical care medical devices offer superior user experiences with patient safety in focus.
Read More
Rimac Automobili – Car Infotainment System
Discover how Rimac Automobili used Qt to build a premium car HMI. Automotive software development and hardware development is best with Qt.
Read More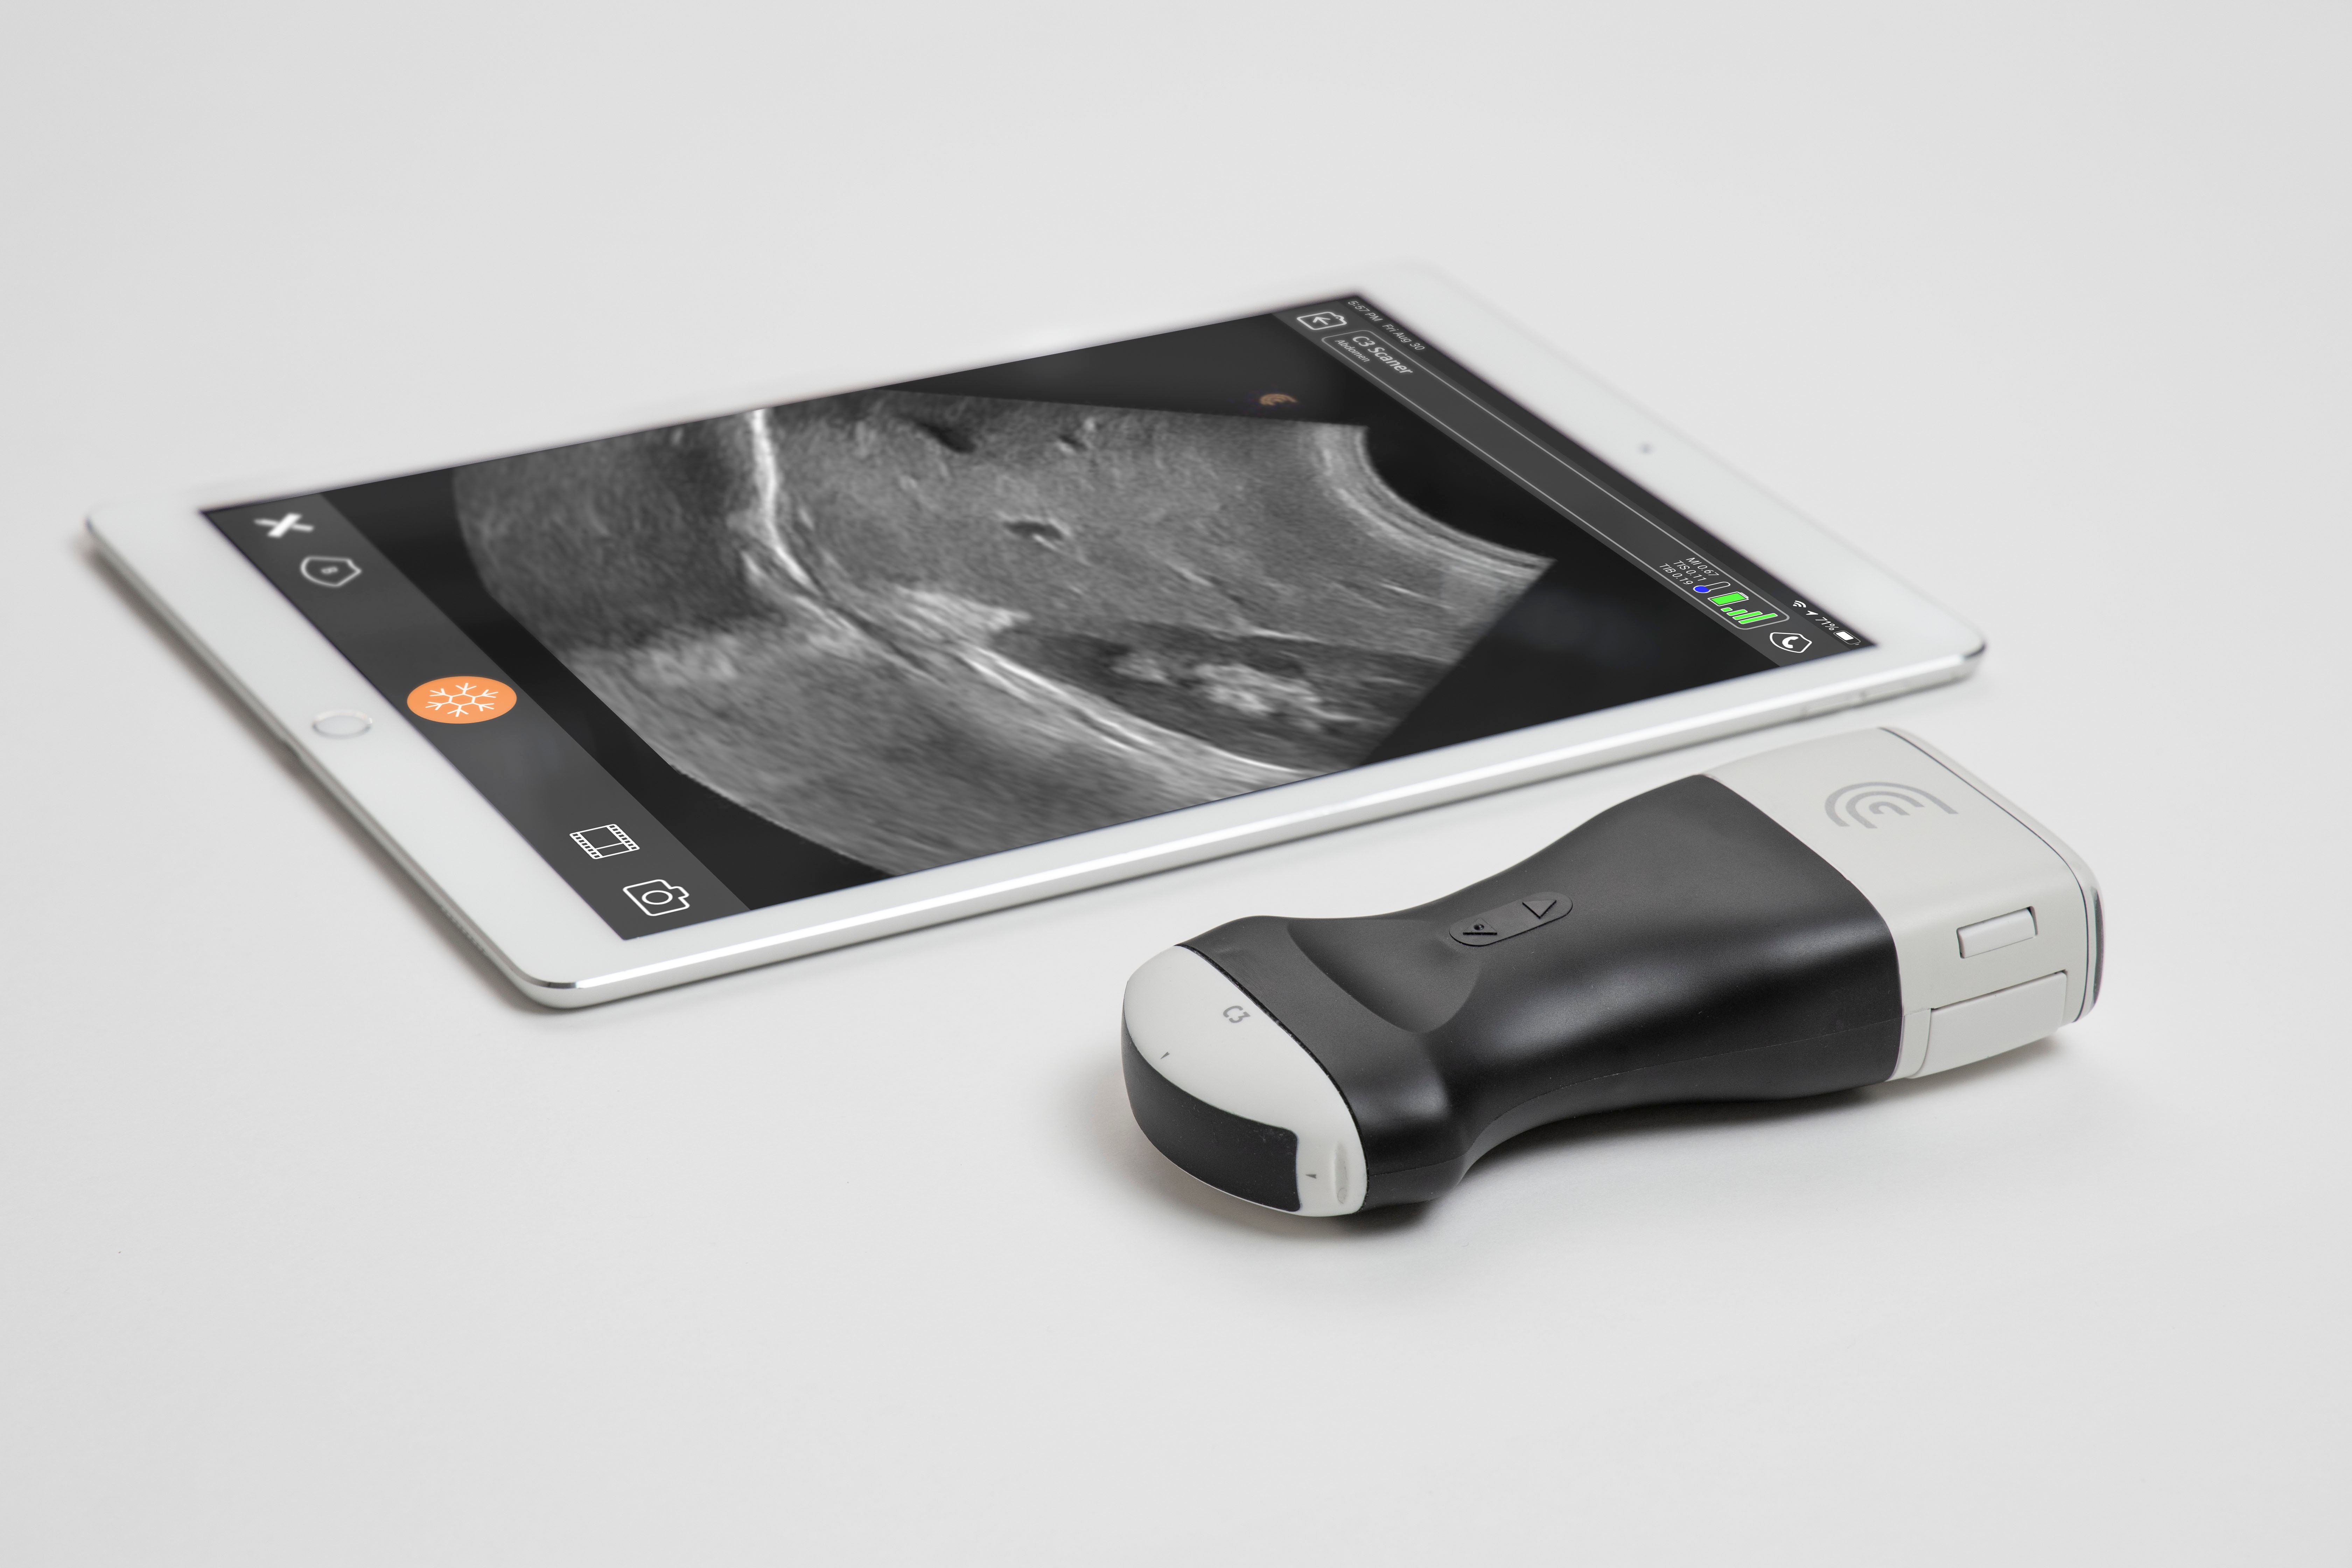
Clarius – Ultra-portable ultrasound scanners Built with Qt
Learn about the pocket sized range of ultrasound scanners shaking up the medical industry, and why they were built with Qt.
Read More
Dubler – Vochlea's real-time voice-to-midi controller Built with Qt
Dubler is a software for musicians. It tracks the pitch, envelope, and timbre of your voice to let you vocally control effects, expression & pitch...
Read More
Eykona – 3D Wound Imaging
Qt-based anesthesia & critical care medical devices offer superior user experiences with patient safety in focus.
Read More
Firstbeat Sports built with Qt
Firstbeat Sports provides holistic physiological performance insights to make informed coaching decisions and maximize the team's performance potentia...
Read More
fman – The Cross-Platform, Dual-Pane File Manager that Makes You Faster!
fman – the cross-platform, dual-pane file manager that makes you faster, built with Qt and Python!
Read More
Formlabs – Advanced Desktop 3D Printers
With Qt, Formlabs delivers intuitive and connected 3D printing experience.
Read More
Framery's Happier & More Efficient Workplaces
Qt empowers Framery, the pioneer and the world’s leading manufacturer of soundproof private spaces for solving noise and privacy issues in open office...
Read More
GLP Systems – A Breakthrough Development in Laboratory Automation
GLP Systems chose Qt because of the comprehensive & highly intuitive APIs, modularized C++ libraries, declarative programming technology, and tool...
Read More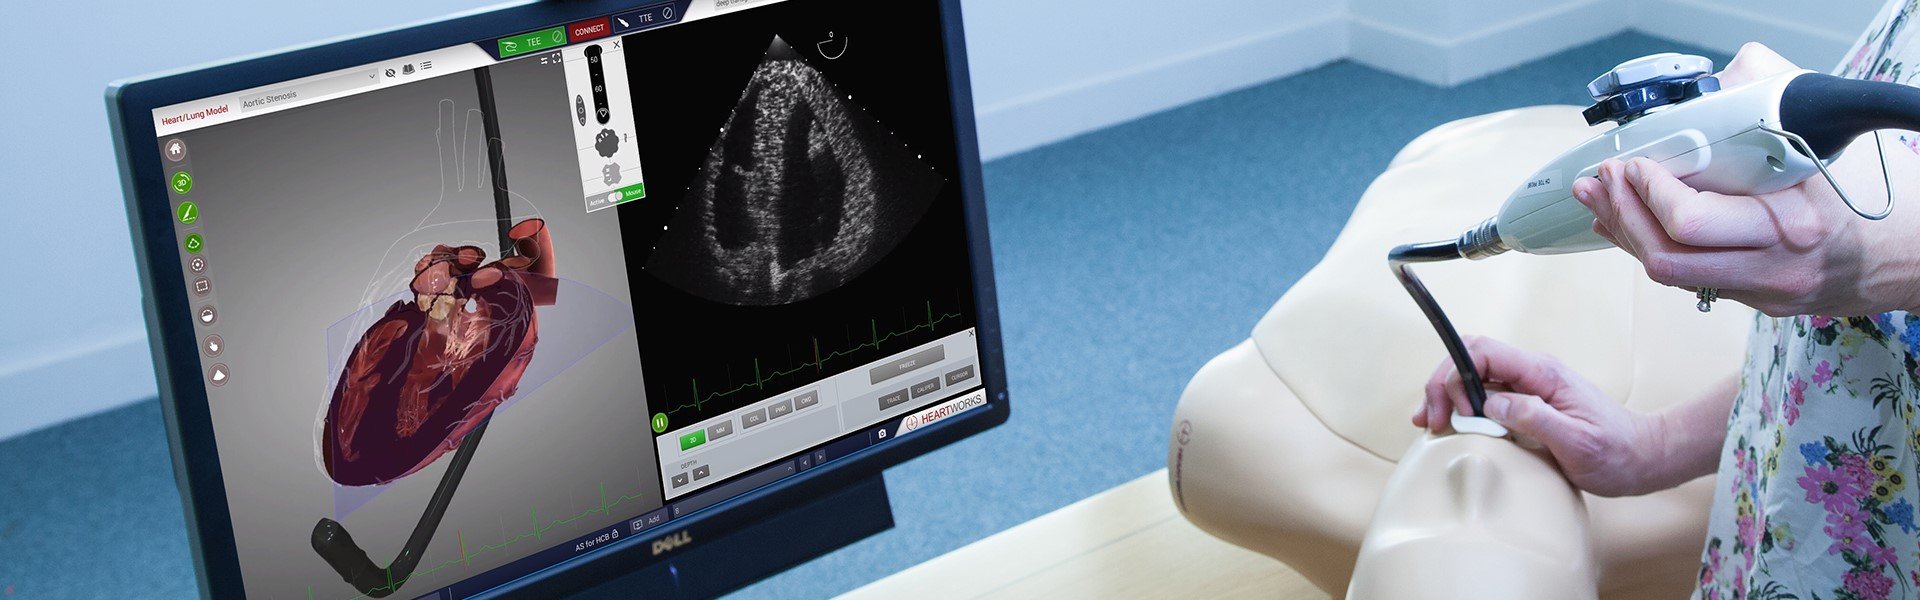
HeartWorks — Training doctors to diagnose heart conditions with world's most accurate 3D virtual heart.
HeartWorks is an ultrasound simulator that uses a computer, a mannequin & 2 ultrasound probes used for teaching cardiac anatomy & echocardiogr...
Read More
Hiri – Enterprise E-mail
Hiri, the best email client for Managers on Windows, Mac, and Linux is built with Qt.
Read More
News: Koenigsegg – Record-Breaking Supercars Built with Qt
Koenigsegg used Qt's complete toolkit and Professional Services to create the ultimate high-performing automotive software.
Read More
Gamry Instruments — Market Leader in Electrochemical Instrumentation Teams up with Qt Service Engineers
Market Leader in Electrochemical Research Teams up with Qt Service Engineers.
Read More
Navico – Marine Navigation & Information System
Navico uses Qt for Lowrance HDS marine electronics range.
Read More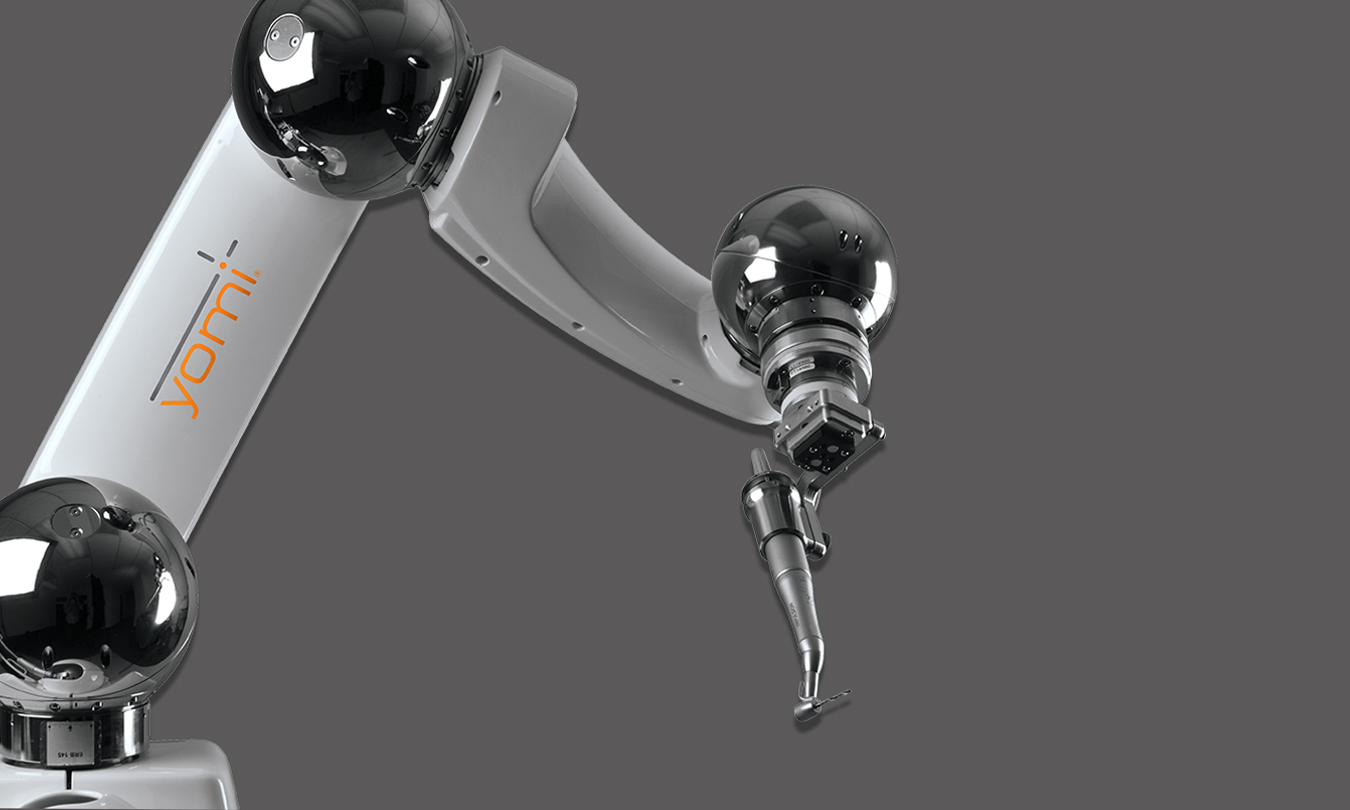
Neocis Dental Robots
Qt empowers Neocis, a dental robotics company, to modernize their UI and make their operation truly cross-platform.
Read More
Novatron Is Bringing Heavy Machinery Into the Digital Era
Read about how Novatron, a technology company focused on earthmoving automation, simplified their UI/UX operations with the help of Qt's framework.
Read More
Panasonic Avionics – Inflight Infotainment
Panasonic Avionics Inflight Entertainment used Qt to develop Inflight Entertainment systems experienced by over five million passengers every day.
Read More
Parker Hannifin – Parker Application Designer
Parker Hannifin has created a tool based on Qt allowing OEMs to consolidate a machine's UIs into one single display.
Read More
Produce Great Quality Work In Less Time With Zenreader
Qt's framework and components power Zenreader, a new tool for collecting and extracting knowledge efficiently whilst retaining the quality of work.
Read More
eyeMaps – Augmented Reality 3D Maps App
Start-up company, eyeMaps, built with Qt to quickly design an augmented reality 3D maps app for iOS & Android. Qt has great documentation & is...
Read More
Article: Scalable and Adaptable Inflight Entertainment System - Innov8Cabin Solutions
Scalable and adaptable inflight entertainment system. Witekio acted as the co-pilot of this new innovative inflight entertainment system - Innov8Cabin...
Read More
Tableau – Business Intelligence and Analytics
Using Qt, the business intelligence and analytics leader has changed the way people use data.
Read More
Ubuntu – Linux Distro
Ubuntu is a single, fully maintained OS that runs across a whole family of personal computing form factors and Qt is at the heart of the Ubuntu's UI f...
Read More
Ulstein – Ship Automation System
Read how Qt brings Ulstein’s daring & industry disruptive vision to reality.
Read More